


This is the hub for gold and silver news today - precious metals market commentary, central bank gold news, gold mining updates, and silver supply deficit analysis, published multiple times weekly by an ex-Scotland Yard financial intelligence analyst. From gold market news today to silver market news today, every update is built to explain what's moving XAU and XAG and why it matters to your position.

Bank of America expects gold to average US$4,000 an ounce in the fourth quarter. The number matters because it comes from a major house and could shape trader expectations ahead of the last quarter of the year. The forecast and where it came from The projection is a Bank of America forecast for the fourth quarter. It sets an average price of US$4,000 per troy ounce for that quarter. That figure is a house view, not a market settlement or guaranteed outcome. How market participants might treat the call Forecasters at large banks carry weight with institutional desks and some private clients, so a US$4,000 average could nudge positioning or derivative pricing if other houses move in the same direction. At the same time, it is a single forecast and should be treated as such. Dealers and funds will balance it against macro data, interest-rate expectations and flows into and out of bullion funds. Possible implications for holders and the market If the forecast gains traction, it could feed bullish sentiment and influence how traders hedge or price forward contracts. Physical markets might see an impact on premiums and demand patterns if investors start to recalibrate expectations for the quarter. None of that follows automatically from the projection; markets often look to multiple sources and incoming data before revising positions. For readers who watch gold priced in dollars, sterling or euros, the key takeaway is simple: a prominent bank has put a high number on Q4. That matters for market psychology, but it remains one house view among many.
 GoldPrice.Live Market Desk
Spot gold and silver finished lower on Monday as a firmer US dollar, stronger oil and elevated US Treasury yields offset safe-haven demand tied to the Strait of Hormuz and the U.S.-Iran tensions. Spot gold was trading near $4,168.90 an ounce, down 0.59%, while spot silver was near $60.120, down 0.96% on the session. What drove the move Short-term Fed expectations have shifted after softer US data, but markets still put only about a 17% chance on an October hike and an 87.7% probability of at least one rise by December. Traders are waiting for September CPI on Wednesday, then PPI and retail sales on Thursday. Meanwhile the US dollar was firmer and the 10-year Treasury yield was around 5.24% before a US cash-bond holiday, keeping pressure on non-yielding assets such as gold. Geopolitics, oil and the Hormuz premium The Strait of Hormuz remains the main geopolitical risk for energy and metals. Iran’s security chief, Mohsen Rezaei, said recent US responses were insufficient and there will be no talks until Tehran’s conditions are met. Oil prices rose: Brent settled near $106.65 a barrel and Nymex WTI was around $93.74, lifting inflation concerns that in turn keep policy and yield risk alive for bullion. Technical picture and market commentary Technically, bulls need a push above the $4,220.89–$4,226.82 zone to aim for $4,271.57 and $4,311.17, while a break below $4,175.03 would open targets at $4,154.99 and $4,141.86. For silver, resistance sits at roughly $61.50–$61.72, with support near $59.96. Trade Nation’s David Morrison warned gold may need to retest "major support around $4,000" before momentum resets. FOREX.com’s Fawad Razaqzada said the recent rebound "has lost some momentum" as the dollar and yields remain elevated. Why bullion desks should care It’s a familiar tug of war: geopolitical risk and ETF or central-bank demand underwrite the market, but the dollar and real yields control day-to-day moves. The coming US inflation releases and how markets price Fed and fiscal risks are likely to be the next decisive factors for gold and silver.
GoldPrice.Live Market Desk 
Silver was trading near $60.26 per troy ounce as of Oct 12, 2026 at 12:05 p.m. ET, down 0.90% or $0.55 from the previous close of $60.81. That leaves the metal about 20.32% higher than it was a year earlier, but well below last year’s peak. Where the numbers stood The snapshot shows silver at $60.26 per ounce. A year ago it was $50.09, a rise of 20.32% over 12 months. Over the last week the metal slipped from $60.85, down 0.96%, and it has declined 6.56% since trading at $64.49 a month ago. The 52-week high is $117.39 and the 52-week low is $46.81 - silver sits 48.66% below the high and 28.74% above the low. What’s driving the move The usual market forces were cited as influencing the price: inflation expectations, central bank policy, the strength of the US dollar, and shifts in physical and industrial demand. These are broad drivers rather than a single new catalyst for the drop on Oct 12. The data point here comes from live market feeds at 12:05 p.m. ET. Levels and what to watch Readers who follow bullion markets will note the large gap to the 52-week high of $117.39 - a reminder of how volatile silver can be. Short-term moves this week are modest: the drop since the previous close was $0.55 and weekly and monthly moves are under 7%. Those figures suggest the market is in a consolidating phase rather than a fresh move higher or lower. This piece reports spot levels from market data and does not offer investment advice. Prices can change quickly and the drivers listed are general factors that tend to influence XAG/USD quotes.
GoldPrice.Live Market Desk 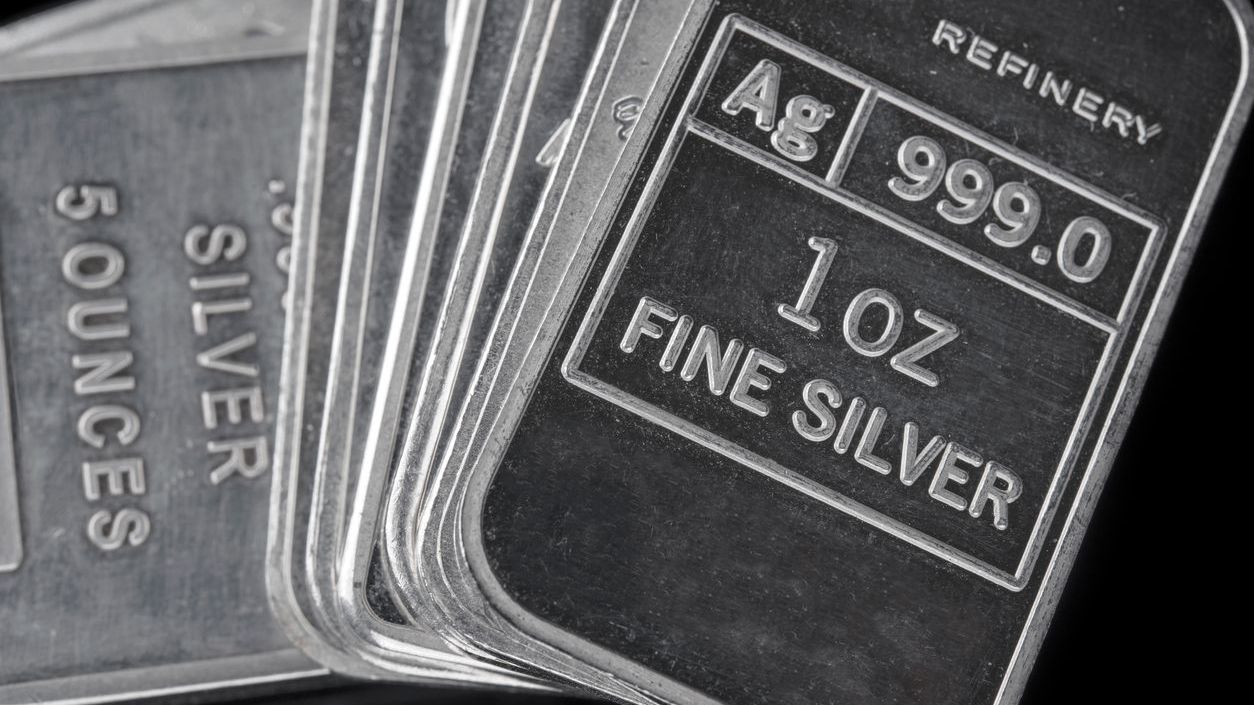
Eloro Resources reported strong assays from the first three holes of an expansion drill phase at its Iska Iska polymetallic project in Bolivia. Hole DSB-96 returned 87.1 metres at 73.26 g/t silver and 0.18% tin, including a shallower 17.9 metres at 190.5 g/t silver and 0.45% tin, figures the company released on October 7. The results matter because the drilling is aimed at expanding and upgrading an indicated silver resource ahead of a planned preliminary economic assessment (PEA) in 2027. Cantor Fitzgerald called DSB-96 "exceptional results for Iska Iska." What the holes actually showed DSB-96 began at 40.4 metres and formed part of a broader 126.1-metre interval grading 54.92 g/t silver. DSB-94, on the western side of the potential starter pit, returned 42 metres at 38.98 g/t silver within 79.5 metres at 30.83 g/t, and deeper cuts included 7.5 metres at 71.96 g/t silver and 43.5 metres at 0.16% tin. DSB-95, on the eastern side, hit polymetallic mineralisation including 6 metres at 1.15 g/t gold, 42.5 g/t silver, 8.07% zinc and 1.23% lead, plus 3 metres at 48.5 g/t silver with 11.37% zinc and 2.30% lead. The company said true width is about 80% of core length. Project scale and timetable The three holes make up 1,459 metres of an initial roughly 10,000-metre phase planned as about 30 holes on a 50-metre grid. Eloro says that phase is on track to finish by year-end, with the overall 40,000-metre programme continuing into 2027. The aim is to upgrade an April 22 resource that showed an indicated 85.17 million tonnes at 40 g/t silver (109.53 million ounces) and a largely inferred 945.43 million tonnes at 8.5 g/t silver (248.6 million ounces). Market backdrop and analyst view The company and its brokers are selling the results into a market where silver dipped to about US$59/oz on October 7 as the dollar strengthened. Independent data cited by the company points to a widening silver deficit next year - the World Silver Survey 2026 expects a 46.3 million ounce shortfall in 2026. Tin has also been strong, trading at about US$54,314 per tonne on October 5, up 47.6% year-on-year. Cantor Fitzgerald said Eloro is "well-funded" for the programme, listed cash at CA$21.8 million with no debt, and kept a Speculative Buy and CA$5.00 target while expecting a resource update and PEA in 2027.
GoldPrice.Live Market Desk 
In Q3 2026 ETFs and central banks together added nearly 296 tonnes of gold, one of the strongest quarterly totals in 23 years of available data. That looks like solid structural demand - except the average gold price for the quarter fell 5.4%, the steepest quarterly decline on record for any quarter with total demand above 150 tonnes since 2003. Who bought, and how much it mattered The headline figure is the combined ETF and official sector purchases of almost 296 tonnes. That level of buying would usually be a clear bid under prices. The unusual twist is that it arrived while the quarterly average price dropped materially, so the buying did not prevent a pullback in the session covered by the data. Where supply and macro forces leave the market The analysis behind the numbers looks at the obvious cross-currents: demand flows from funds and central banks on one side, and drivers such as conflict, bond yields, inflation and interest-rate expectations on the other. The figures imply persistent structural demand, but the price move in Q3 shows macro variables were strong enough to overwhelm that support during the period reported. What matters for Q4 The question for holders and watchers is whether the buying seen in Q3 constitutes a durable support level that can lift gold in Q4, or whether the same macro forces that pushed the price down will reassert themselves. The article examines technical indicators alongside the demand and macro picture, but readers should note that technicals and single-analyst calls are only one part of the story. Key items to watch continued ETF flows and central bank purchases any escalation or easing of geopolitical conflict that shifts safe-haven demand
GoldPrice.Live Market Desk 
Delegates at the Global Precious Metals Conference in Sorrento, which wrapped on 6 October, pushed their median LBMA gold-price forecast higher during the meeting. At the start of Day One the poll produced a $4,895.5 forecast for the gold price at the time of the next conference; by the end of Day Two that median had risen to $5,013.3. What the poll recorded and who was asked The figures come from delegate polls conducted during the conference in Sorrento. Alongside the LBMA gold-price numbers, participants gave median forecasts for other benchmark metals for the same future date: silver $97.4 per troy ounce, platinum $1,913.5 and palladium $1,414.7. The room was the source of the numbers rather than a single institution or model. How the forecasts shifted through the event The chief movement noted was in gold, where the median expectation rose by more than $100 during the sessions reported. The other metals are presented as single-point medians; the conference notes do not provide ranges, polling sizes or the timing behind those particular numbers. Why bullion desks might file this under sentiment These polls are a snapshot of attendee expectations at a specific industry event. That gives them value as a sentiment gauge: dealers and desks can use the numbers to sense how participants are positioning mentally for the year ahead. They are not market prices and they are not the same as formal forecasts from central banks, large fund managers or the Exchange. Readers should treat the figures cautiously - useful for colour, not as a substitute for traded benchmarks or public institutional guidance.
GoldPrice.Live Market Desk 
Rising gold costs are steering many Indian shoppers away from heavy yellow-gold pieces and towards diamond-studded jewellery, according to retailers. Gold has climbed about 54% since the last festive season, while small diamonds are roughly a quarter cheaper than a year ago, making studded designs more affordable for everyday wear. Retailers see double‑digit growth for diamonds Major chains are expecting brisk demand. Joyalukkas said it expects a 20% rise in diamond sales this festive season. "We are expecting a growth of 20% in diamond jewellery this festive season," said Joy Alukkas. Senco Gold & Diamonds also forecasts about 20% growth in everyday-wear diamond pieces, and Kumari Fine Jewellery expects 15–20% growth. Retailers report strong movement in the Rs 30,000-Rs 1 lakh bracket, while lighter diamond items are available from roughly Rs 10,000. How product mix is changing Jewellers are using lower carat gold and lighter weights to keep prices down, offering pieces in 18-carat, 14-carat and 9-carat gold, and promoting contemporary, versatile designs rather than heavy bridal sets. One retailer noted customers who previously bought 100 gram necklaces are settling for 60 grams. Firms also point to the appeal of small stones and simpler settings for daily wear. What this could mean for gold demand The trend is a demand substitution rather than a structural collapse in gold appetite. If retailers’ projections materialise, the festival season could see a measurable shift within the retail jewellery segment away from high-gram yellow-gold and towards diamond-studded alternatives. That would matter to physical gold flows in India, a major market, but the figures quoted are retailer expectations rather than industry-wide data. Competition among chains, and regional players expanding their footprints, may reinforce the switch in the near term.
GoldPrice.Live Market Desk 
Guanajuato Silver has finished a 267m underground production ramp that links the San Ignacio mine directly into the Bolañitos processing complex in Guanajuato. The company says the link will cut haulage distances, speed cycle times and improve ventilation across the connected workings. What Guanajuato built and where Construction on the 4m by 4.5m ramp began in May 2026 and the drive broke through to the Lucero area on 30 September 2026, ahead of schedule. The tunnel provides direct access to Bolañitos' central plant, lets the operator use larger haulage equipment and includes a loading pocket at San Ignacio to reduce surface transfers. What the sampling found and next steps During development the ramp intersected extensions of the Cecilia vein system. Reported sampling highlights included a 3.25m intercept grading 6.02g/t gold and 145g/t silver on the Cecilia #4 vein, and 1.3m at 2.68g/t gold and 15g/t silver on Cecilia #3. Guanajuato Silver has started a targeted drilling programme to test whether those intersections add to resources. The company also plans a combined geological model, updated resources and reserves, a property-wide exploration plan, 2027 mine forecasts and a new life-of-mine model. How the link changes operations at Bolañitos The company frames the ramp as an operational optimisation: lower diesel consumption, fewer surface transfers, less road maintenance and faster material cycles. Management says the connection will "increase ventilation at San Ignacio", and it describes the work as an initial milestone in fully integrating San Ignacio into Bolañitos' footprint. If drilling converts the sampled veins into mineable tonnes, the tunnel could feed extra material to the central mill without building a second processing plant. Context from other Mexican projects Guanajuato's approach follows a familiar pattern in Mexico where operators link nearby deposits into a single processing hub to cut costs. The note references longer tunnels elsewhere, such as Torex Gold's Guajes tunnel, to illustrate the engineering rationale behind underground connectivity.
GoldPrice.Live Market Desk 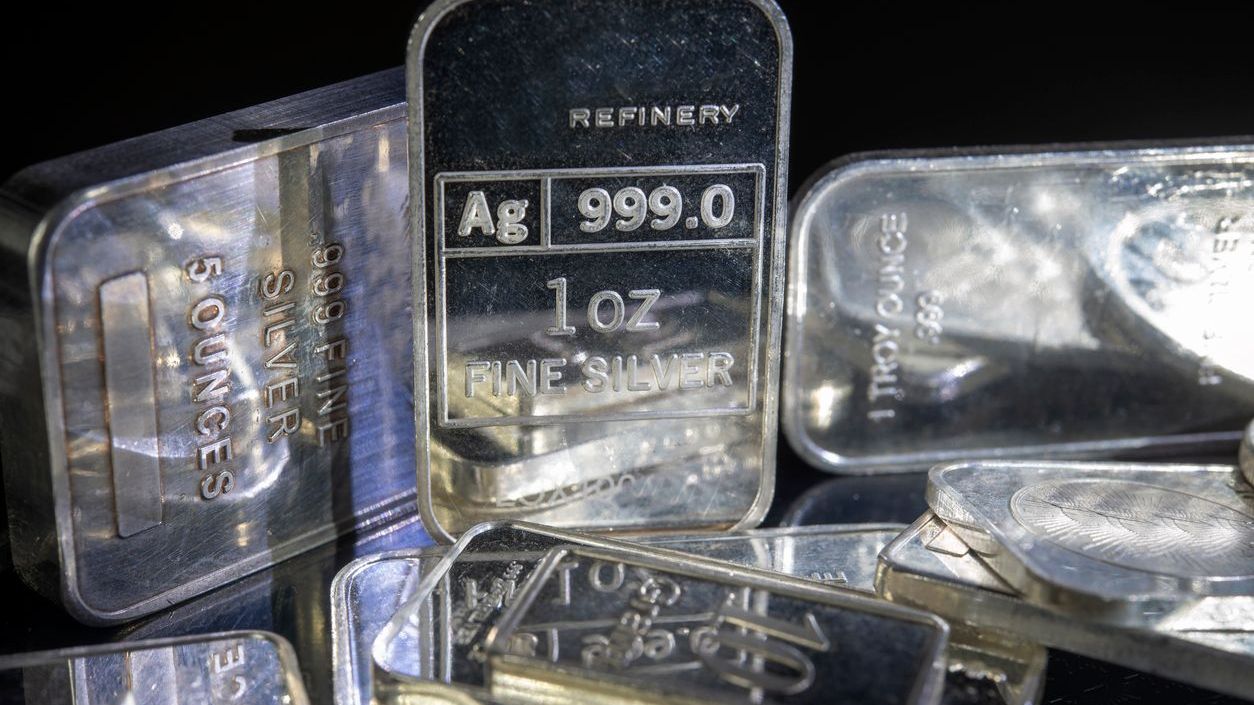
Silver has lost a lot of its shine. The metal hit highs of more than $120 in January and has since fallen to about half that level, while the iShares Silver Trust (NYSEMKT:SLV) has dropped 21% year to date. Long-term holders still show healthy returns - SLV is up about 160% over five years - but the short-term picture is weaker and investors are reassessing where silver fits in a higher-yield world. The raw numbers behind the sell-off The piece focuses on two simple facts from recent months: silver’s January peak above $120 and the subsequent decline to roughly half that price, and SLV’s 21% fall this year. Those moves are presented alongside the fund’s five-year gain of 160%, a reminder that recent weakness follows a sizeable rally. What the commentary pins the move on The explanation offered links political and macro risks to demand for silver. The forthcoming US midterm elections are flagged as a possible trigger for renewed uncertainty - the argument is that a shift in control of Congress could alter expectations and push investors back toward precious metals. At the same time the article highlights bond yields: high yields are argued to be a headwind for silver, while falling yields, perhaps after cooling inflation, could help prices recover. How much of this is market fact and how much is opinion? The suggestion to buy SLV while it is cheaper is an opinion rather than new market data. The article frames silver as both speculative and a safe-haven asset, and uses the fund’s recent performance to argue it may be a discounted way to gain exposure. Readers should note those lines of argument rest on forecasts about politics and yields rather than fresh supply or demand statistics. The piece doesn’t report fund flows or official data, it offers a view that a return to political or yield-driven volatility could lift silver again.
GoldPrice.Live Market Desk 
Bank of America left its near-term gold view unchanged on Monday, saying the metal is unlikely to remain above $4,000 an ounce over the coming three months. The call hinges on soft physical buying in several major markets, even as exchange-traded funds have continued to attract money.Private holders and bullion desks should care because the forecast comes from a major bank and rests on demand patterns that can alter how prices respond to macro moves such as Fed policy and dollar strength.What the bank forecast and recent tradingThe analysts set a fourth-quarter 2026 average for gold of $4,000 an ounce and left a calendar‑2027 average at $4,813. In an earlier note they flagged a possible fourth‑quarter low of $3,750 if high energy costs keep inflation elevated. Spot gold had been trading near $4,168.90 an ounce, down about 0.59% for the session when the bank published its commentary.Why the analysts are cautiousBank of America pointed to two demand puzzles. First, while ETFs have seen favourable inflows over the past two months, the bank warned those flows could turn into selling if prices soften. Second, tracking suggests physical buyers such as some central banks, China and India have cut purchases recently, reducing a traditional source of support. The analysts also argued much of recent gains in headline gold holdings were driven by valuation moves rather than fresh buying.What could change the outlookThe bank says clearer direction from the Federal Reserve is needed before gold finds a durable bottom. It expects a dovish pivot from the Fed would be the strongest bullish catalyst, but also notes a scenario in which renewed worries about US dollar debasement could lift the metal. Specifically, if the Treasury leant on short‑term issuance and the Fed kept short rates low, pressure on the dollar could revive gold demand. Middle East hostilities are another wild card the bank highlights; they could either spur buying or prompt some central banks to sell.
GoldPrice.Live Market Desk 
As at the end of September 2026, London vaults held 9,821 tonnes of gold, a 1.96% increase on the previous month, and 28,985 tonnes of silver, up 1.95%. The gold was valued at $1.3 trillion and equates to roughly 785,690 standard bars; the silver was valued at $56.6 billion, about 966,175 bars.The totals were published on the fifth business day of the month for the previous month, following a recent decision to begin releasing equivalent silver figures. The release is intended to give market participants clearer and timelier sight of how much metal is sitting in London.Raw totals and the immediate detailThe headline numbers are straightforward: 9,821 tonnes of gold and 28,985 tonnes of silver as of end-September. The month-on-month moves were small but notable, a near 2% rise for each metal. The published values and bar equivalents were supplied alongside the tonnage, giving both a market-value and physical-bar perspective.Why London vault totals matter to the OTC marketLondon remains a central hub for the over-the-counter bullion market, and monthly vault totals help show whether the city can physically underpin trading and settlement. Regular, timely publication makes it easier for desks and allocators to gauge available inventory and to compare paper positions with stored metal.What the numbers don’t resolveThe published totals improve transparency, but they are aggregate figures. They don’t identify owners, timing of arrivals, or internal transfers between vaults. The data is useful as a stock snapshot, not a complete map of flows or counterparty exposure. Readers should treat the figures as a clearer view of inventories in London, rather than a full accounting of the global physical market.
GoldPrice.Live Market Desk 
The Extractive Industries Transparency Initiative said its reporting framework now covers 56 countries and roughly 3,900 entities, and that governments have disclosed $3.6 trillion in extractive-sector revenue since 2003. The group argues that disclosure is shifting from payment lists to ownership, licences and project agreements - changes that have led to renegotiations and bigger revenue claims in several producing countries. How disclosure has been used in practice EITI's review highlights concrete outcomes. In the Democratic Republic of Congo an EITI study helped expose departures from the original Sicomines copper-cobalt deal; negotiations that followed produced a revised agreement in 2024 increasing planned infrastructure spending to $7 billion from $3 billion. The DRC widened fiscal modelling in 2025 to cover projects representing about 80% of its mining fiscal revenue. Ghana shelved a 2020 plan to sell a 49% stake in Agyapa Royalties after EITI-commissioned modelling valued the asset at about $1.5 billion, rather than the $500–$750 million then cited; later work suggested Ghana preserved $270–$300 million as gold prices rose. In Papua New Guinea EITI reporting informed talks that raised the government and landowners' stake in Porgera to 51% from 15%. Where disclosure exposes losses and risks Ownership and trade data have flagged potential leakages. Cameroon reported 22.3 kg of gold exports in 2023 while the UAE recorded more than 15 tonnes of imports from Cameroon that year, prompting enforcement action. A study cited by EITI estimated Burkina Faso lost $4.9 billion to illicit mining-related flows between 2012 and 2021. Several countries now use beneficial-ownership checks in licensing: Armenia rejected an exploration bid after checks; Ghana refused a renewal following links to criminal records; Colombia has tightened due diligence. Limits, context and what comes next Research cited by EITI is cautiously positive: a 2026 study of 83 developing countries found higher natural-resource revenue after joining EITI, and another linked membership to stronger foreign investment in low-transparency states. But a 2025 study of 50 countries found more disclosure did not automatically change perceptions of corruption. EITI itself says impact is uneven and that the test ahead is whether richer, accessible data consistently prompts government action as competition for copper, lithium and other critical minerals heats up.
GoldPrice.Live Market Desk Spot gold and silver finished lower on Monday as a firmer US dollar, stronger oil and elevated US Treasury yields offset safe-haven demand tied to the Strait of Hormuz and the U.S.-Iran tensions. Spot gold was trading near $4,168.90 an ounce, down 0.59%, while spot silver was near $60.120, down 0.96% on the session. What drove the move Short-term Fed expectations have shifted after softer US data, but markets still put only about a 17% chance on an October hike and an 87.7% probability of at least one rise by December. Traders are waiting for September CPI on Wednesday, then PPI and retail sales on Thursday. Meanwhile the US dollar was firmer and the 10-year Treasury yield was around 5.24% before a US cash-bond holiday, keeping pressure on non-yielding assets such as gold. Geopolitics, oil and the Hormuz premium The Strait of Hormuz remains the main geopolitical risk for energy and metals. Iran’s security chief, Mohsen Rezaei, said recent US responses were insufficient and there will be no talks until Tehran’s conditions are met. Oil prices rose: Brent settled near $106.65 a barrel and Nymex WTI was around $93.74, lifting inflation concerns that in turn keep policy and yield risk alive for bullion. Technical picture and market commentary Technically, bulls need a push above the $4,220.89–$4,226.82 zone to aim for $4,271.57 and $4,311.17, while a break below $4,175.03 would open targets at $4,154.99 and $4,141.86. For silver, resistance sits at roughly $61.50–$61.72, with support near $59.96. Trade Nation’s David Morrison warned gold may need to retest "major support around $4,000" before momentum resets. FOREX.com’s Fawad Razaqzada said the recent rebound "has lost some momentum" as the dollar and yields remain elevated. Why bullion desks should care It’s a familiar tug of war: geopolitical risk and ETF or central-bank demand underwrite the market, but the dollar and real yields control day-to-day moves. The coming US inflation releases and how markets price Fed and fiscal risks are likely to be the next decisive factors for gold and silver.
Bank of America expects gold to average US$4,000 an ounce in the fourth quarter. The number matters because it comes from a major house and could shape trader expectations ahead of the last quarter of the year. The forecast and where it came from The projection is a Bank of America forecast for the fourth quarter. It sets an average price of US$4,000 per troy ounce for that quarter. That figure is a house view, not a market settlement or guaranteed outcome. How market participants might treat the call Forecasters at large banks carry weight with institutional desks and some private clients, so a US$4,000 average could nudge positioning or derivative pricing if other houses move in the same direction. At the same time, it is a single forecast and should be treated as such. Dealers and funds will balance it against macro data, interest-rate expectations and flows into and out of bullion funds. Possible implications for holders and the market If the forecast gains traction, it could feed bullish sentiment and influence how traders hedge or price forward contracts. Physical markets might see an impact on premiums and demand patterns if investors start to recalibrate expectations for the quarter. None of that follows automatically from the projection; markets often look to multiple sources and incoming data before revising positions. For readers who watch gold priced in dollars, sterling or euros, the key takeaway is simple: a prominent bank has put a high number on Q4. That matters for market psychology, but it remains one house view among many.
GoldPrice.Live Market Desk|Oct 13, 2026Spot gold and silver finished lower on Monday as a firmer US dollar, stronger oil and elevated US Treasury yields offset safe-haven demand tied to the Strait of Hormuz and the U.S.-Iran tensions. Spot gold was trading near $4,168.90 an ounce, down 0.59%, while spot silver was near $60.120, down 0.96% on the session. What drove the move Short-term Fed expectations have shifted after softer US data, but markets still put only about a 17% chance on an October hike and an 87.7% probability of at least one rise by December. Traders are waiting for September CPI on Wednesday, then PPI and retail sales on Thursday. Meanwhile the US dollar was firmer and the 10-year Treasury yield was around 5.24% before a US cash-bond holiday, keeping pressure on non-yielding assets such as gold. Geopolitics, oil and the Hormuz premium The Strait of Hormuz remains the main geopolitical risk for energy and metals. Iran’s security chief, Mohsen Rezaei, said recent US responses were insufficient and there will be no talks until Tehran’s conditions are met. Oil prices rose: Brent settled near $106.65 a barrel and Nymex WTI was around $93.74, lifting inflation concerns that in turn keep policy and yield risk alive for bullion. Technical picture and market commentary Technically, bulls need a push above the $4,220.89–$4,226.82 zone to aim for $4,271.57 and $4,311.17, while a break below $4,175.03 would open targets at $4,154.99 and $4,141.86. For silver, resistance sits at roughly $61.50–$61.72, with support near $59.96. Trade Nation’s David Morrison warned gold may need to retest "major support around $4,000" before momentum resets. FOREX.com’s Fawad Razaqzada said the recent rebound "has lost some momentum" as the dollar and yields remain elevated. Why bullion desks should care It’s a familiar tug of war: geopolitical risk and ETF or central-bank demand underwrite the market, but the dollar and real yields control day-to-day moves. The coming US inflation releases and how markets price Fed and fiscal risks are likely to be the next decisive factors for gold and silver.
GoldPrice.Live Market Desk|Oct 13, 2026