


 By Rick Adams•September 28, 2026
Watch the gold price on GoldPrice.Live for five minutes and you'll see it tick up and down dozens of times. Come back tomorrow and it'll be somewhere else entirely. For a metal that mostly sits in vaults doing nothing, gold has a remarkably restless price. That struck me in my first weeks on the four-year Theseus research project, and it's never stopped being true. If you've ever wondered why the gold price changes daily - sometimes by the second - read on.
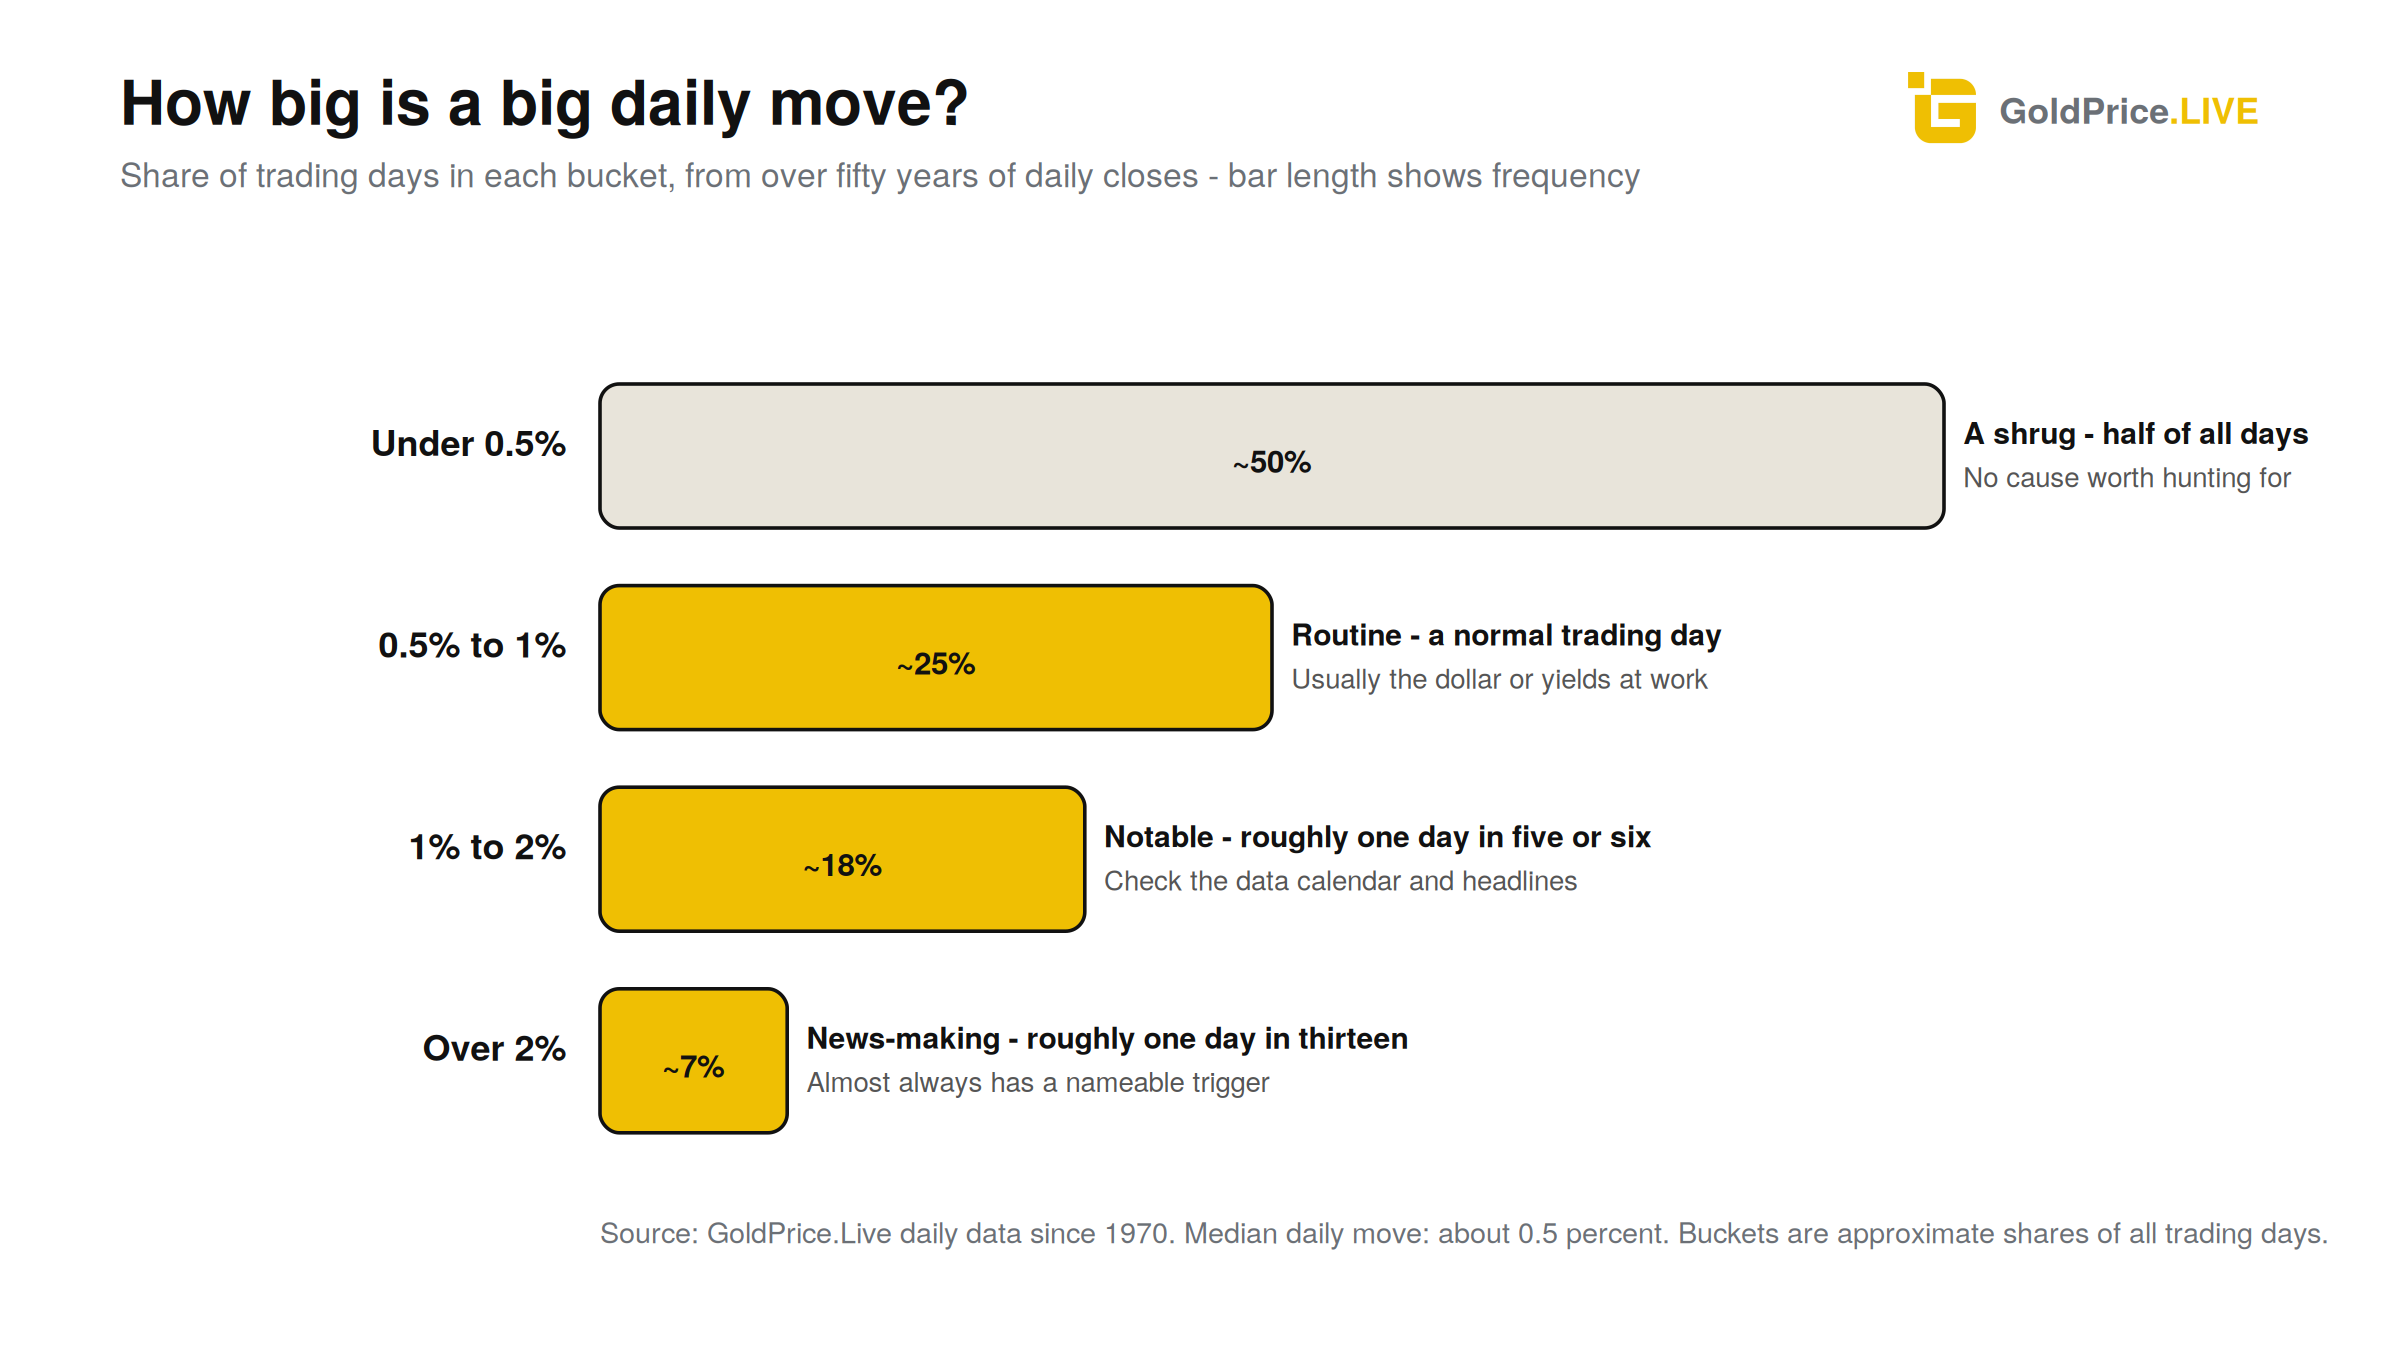
Here's a number worth having in your back pocket. Across more than half a century of daily data, gold's typical move from one day's close to the next is about half a percent. Roughly one day in four it moves more than 1 percent. About one day in thirteen it moves more than 2 percent, and those are the days it makes the news. So daily movement isn't a malfunction or a mystery. It's the normal breathing of a market that never stops trading.
 The question is what's doing the breathing. In my last piece I explained what the gold price actually is and who sets it. This one tackles the follow-up question I hear most: what makes it move? The answer comes in layers - the machinery that lets it move at all, the handful of forces that push it around on any given day, and the slower rhythms underneath. Let's work through them.
A market that never stops: why gold can move every second
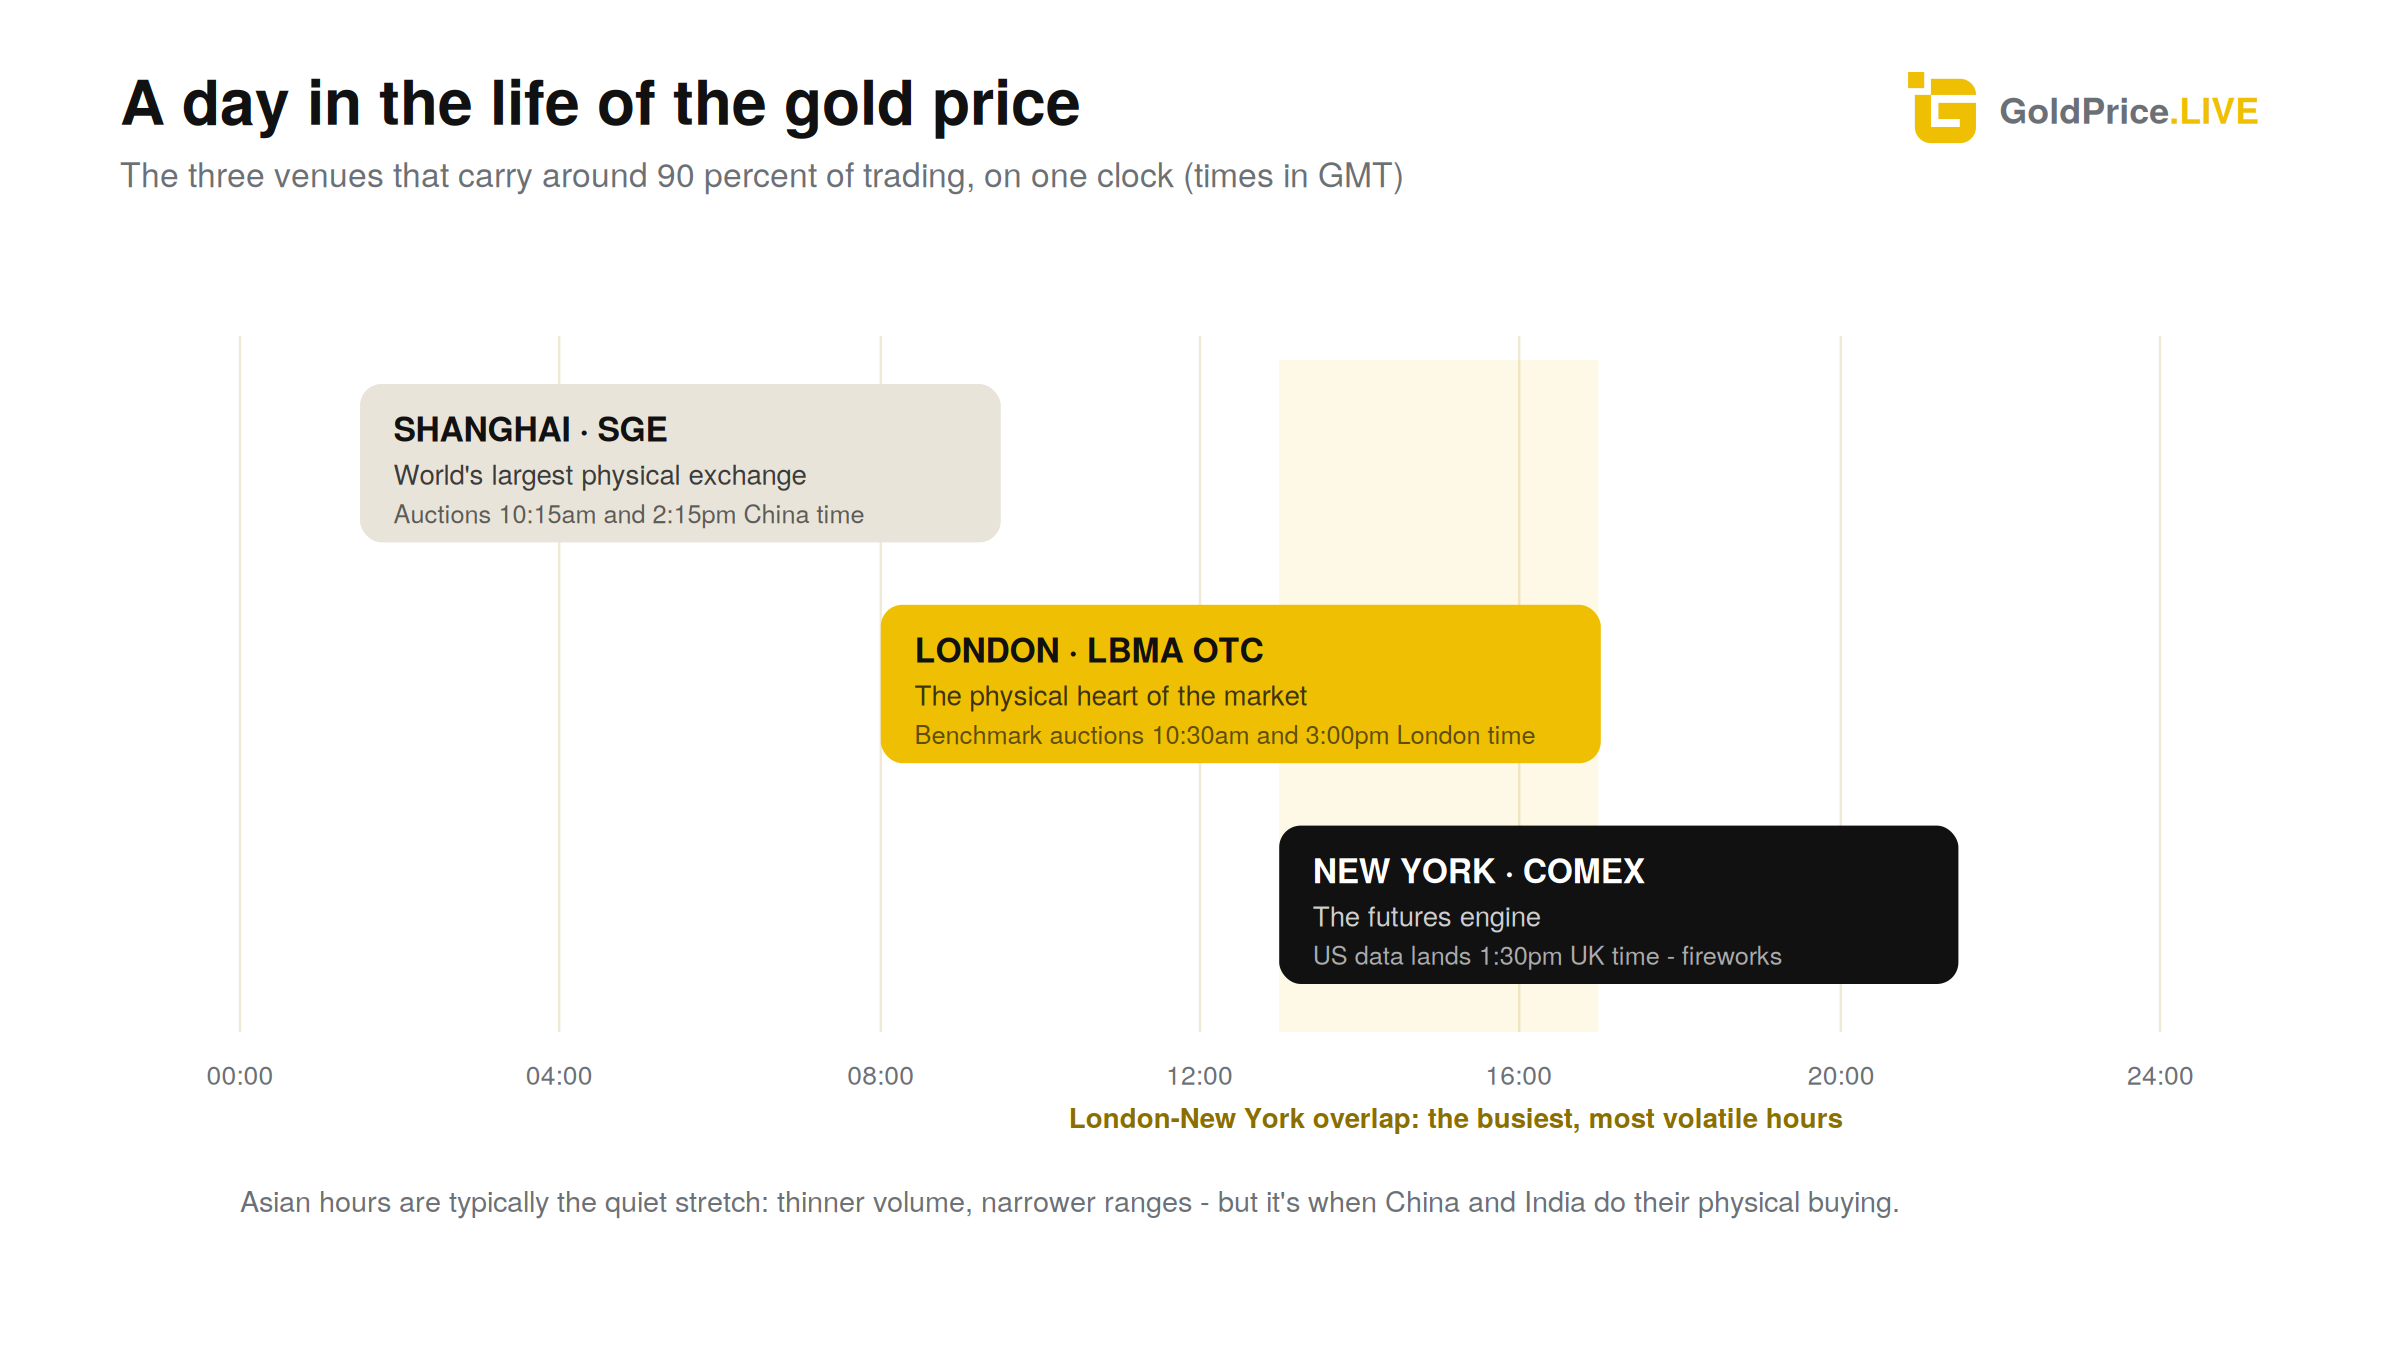
Gold moves constantly because it trades constantly. Around 90 percent of the world's gold trading flows through three venues, and between them they cover the clock.
London is the physical heart, where bullion banks and central banks deal directly with each other through the day. New York's COMEX is the futures engine, where 100 ounce contracts change hands every second the exchange is open and electronic trading fills in most of the rest of the day. And the third pillar, less familiar to Western readers, sits in Shanghai.
The Shanghai Gold Exchange was set up by the People's Bank of China in October 2002 and has grown into the largest physical gold exchange on the planet. Virtually every ounce imported into China, mined there or recycled there passes across it. Since April 2016 it has also run its own twice-daily benchmark auction, pricing gold in yuan at 10:15am and 2:15pm China time - a deliberate echo of London's morning and afternoon benchmarks, and a statement that the world's biggest gold-consuming nation intends to be a price-setter, not just a price-taker.
Put the three together and you get a market with no closing bell. Trading opens in Asia on Monday morning while it's still Sunday evening in New York, and the price doesn't properly stop until Friday evening US time. Within those trading hours, every fresh trade nudges the number you see on screen. That's the machinery. Now for the forces that drive it.
Why gold price changes: the five daily forces
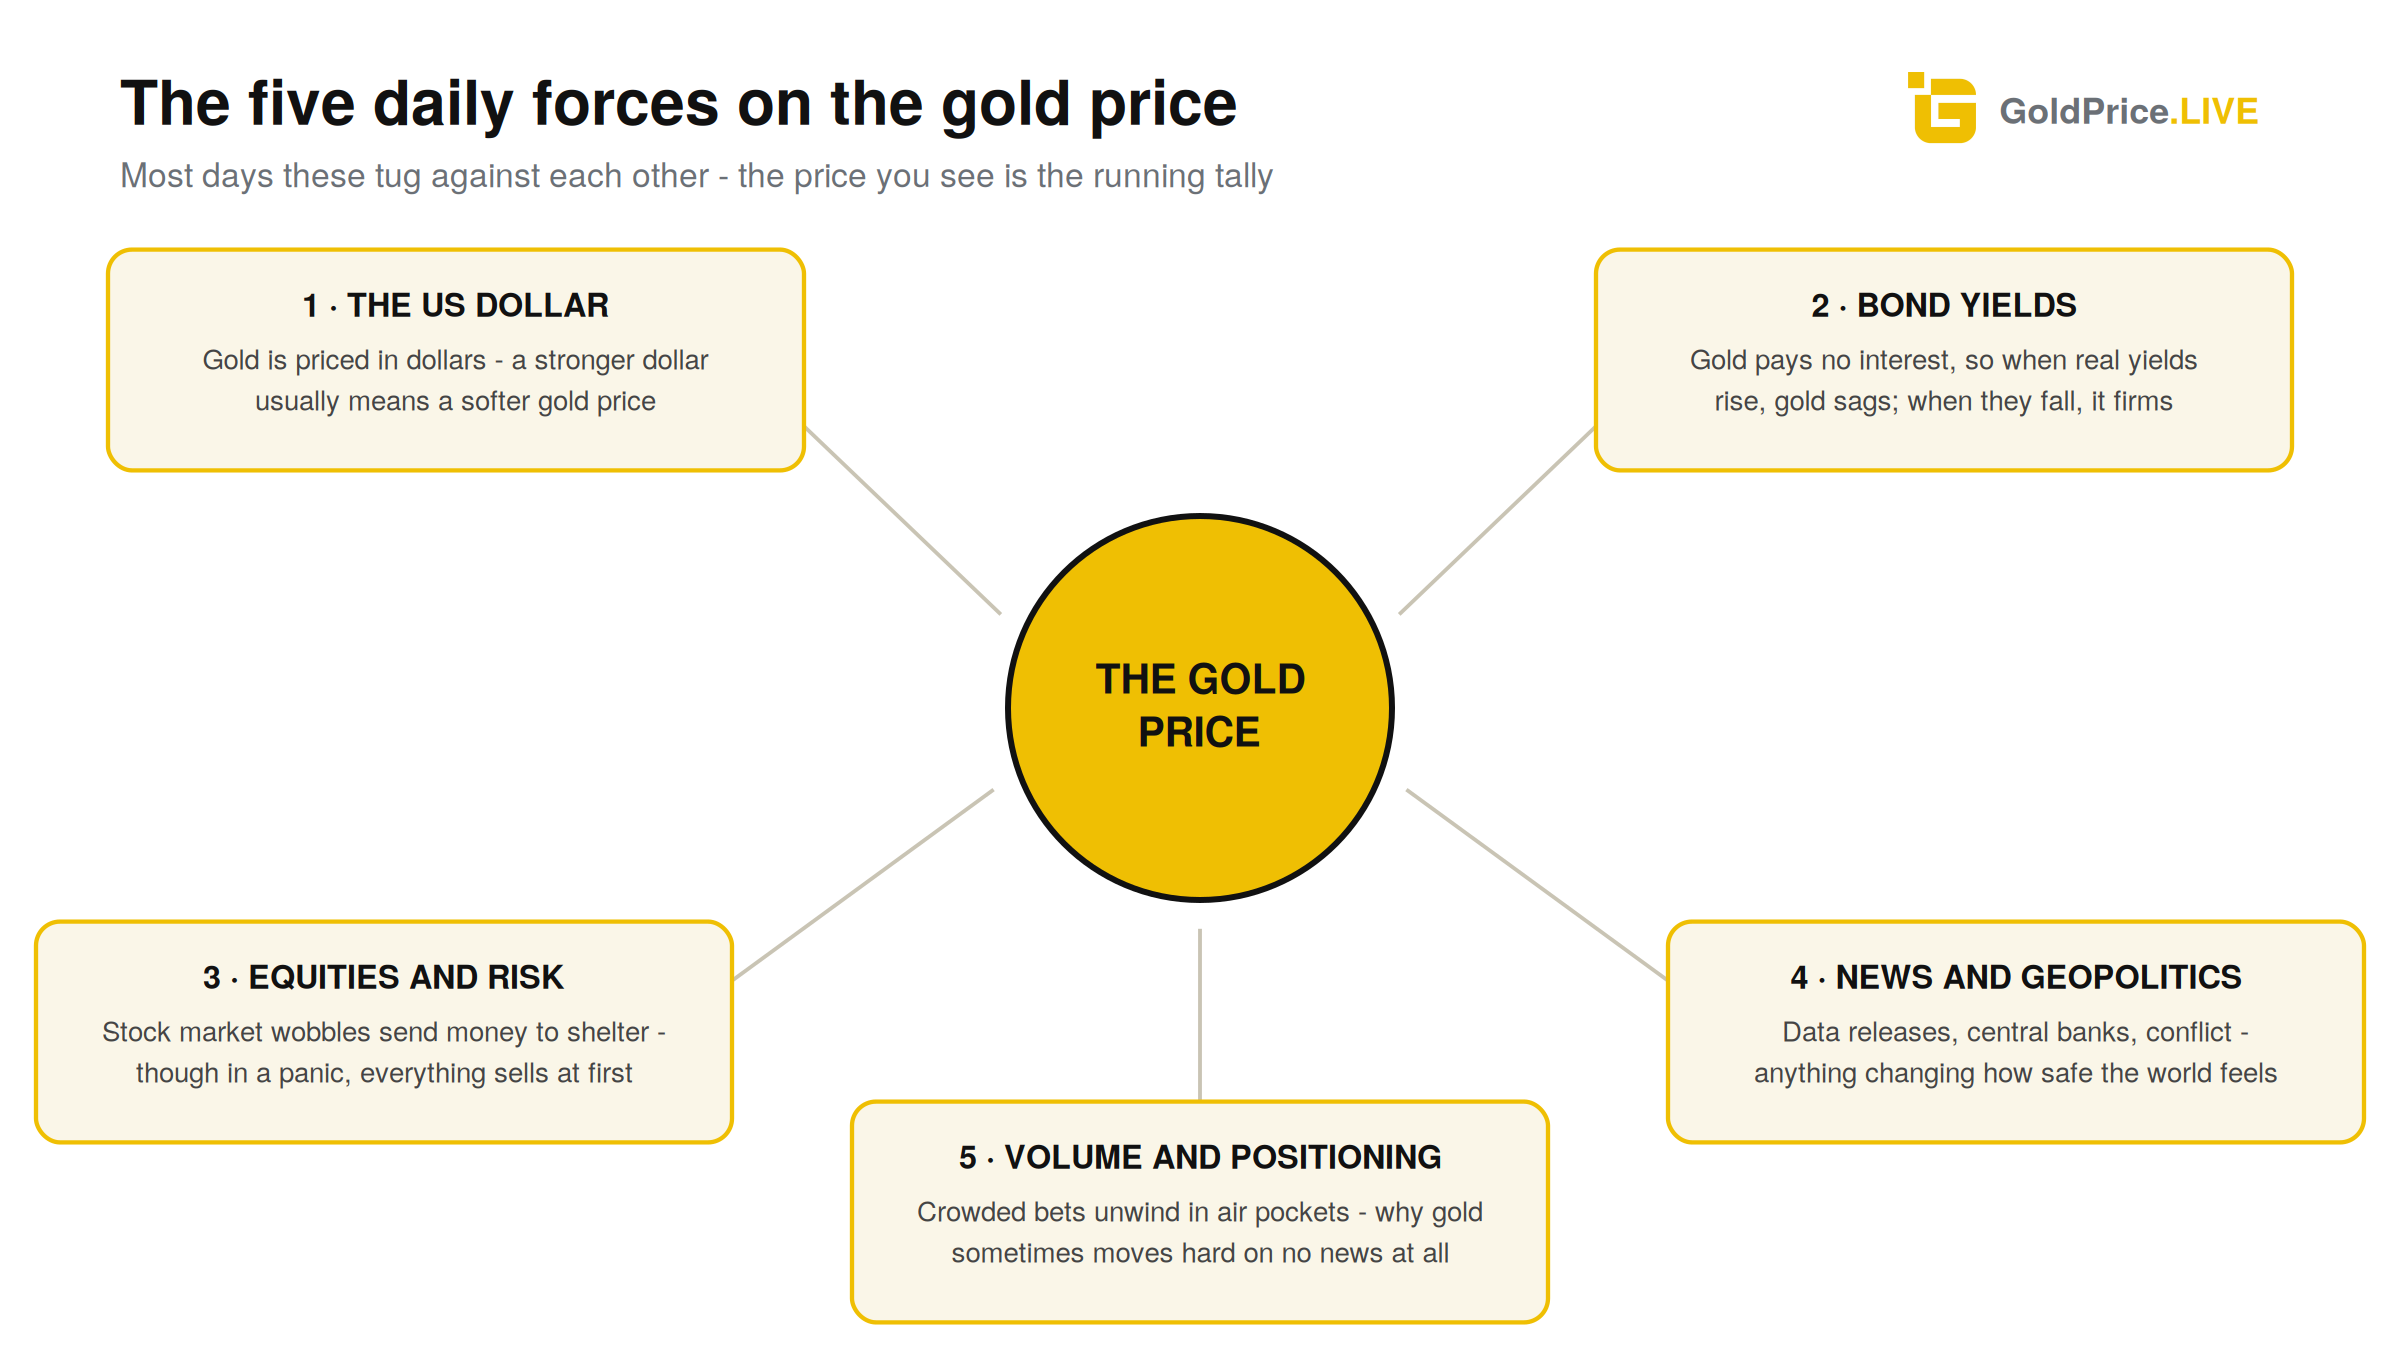
On any normal day, gold price movement comes down to five inputs. Some days one dominates; most days they tug against each other.
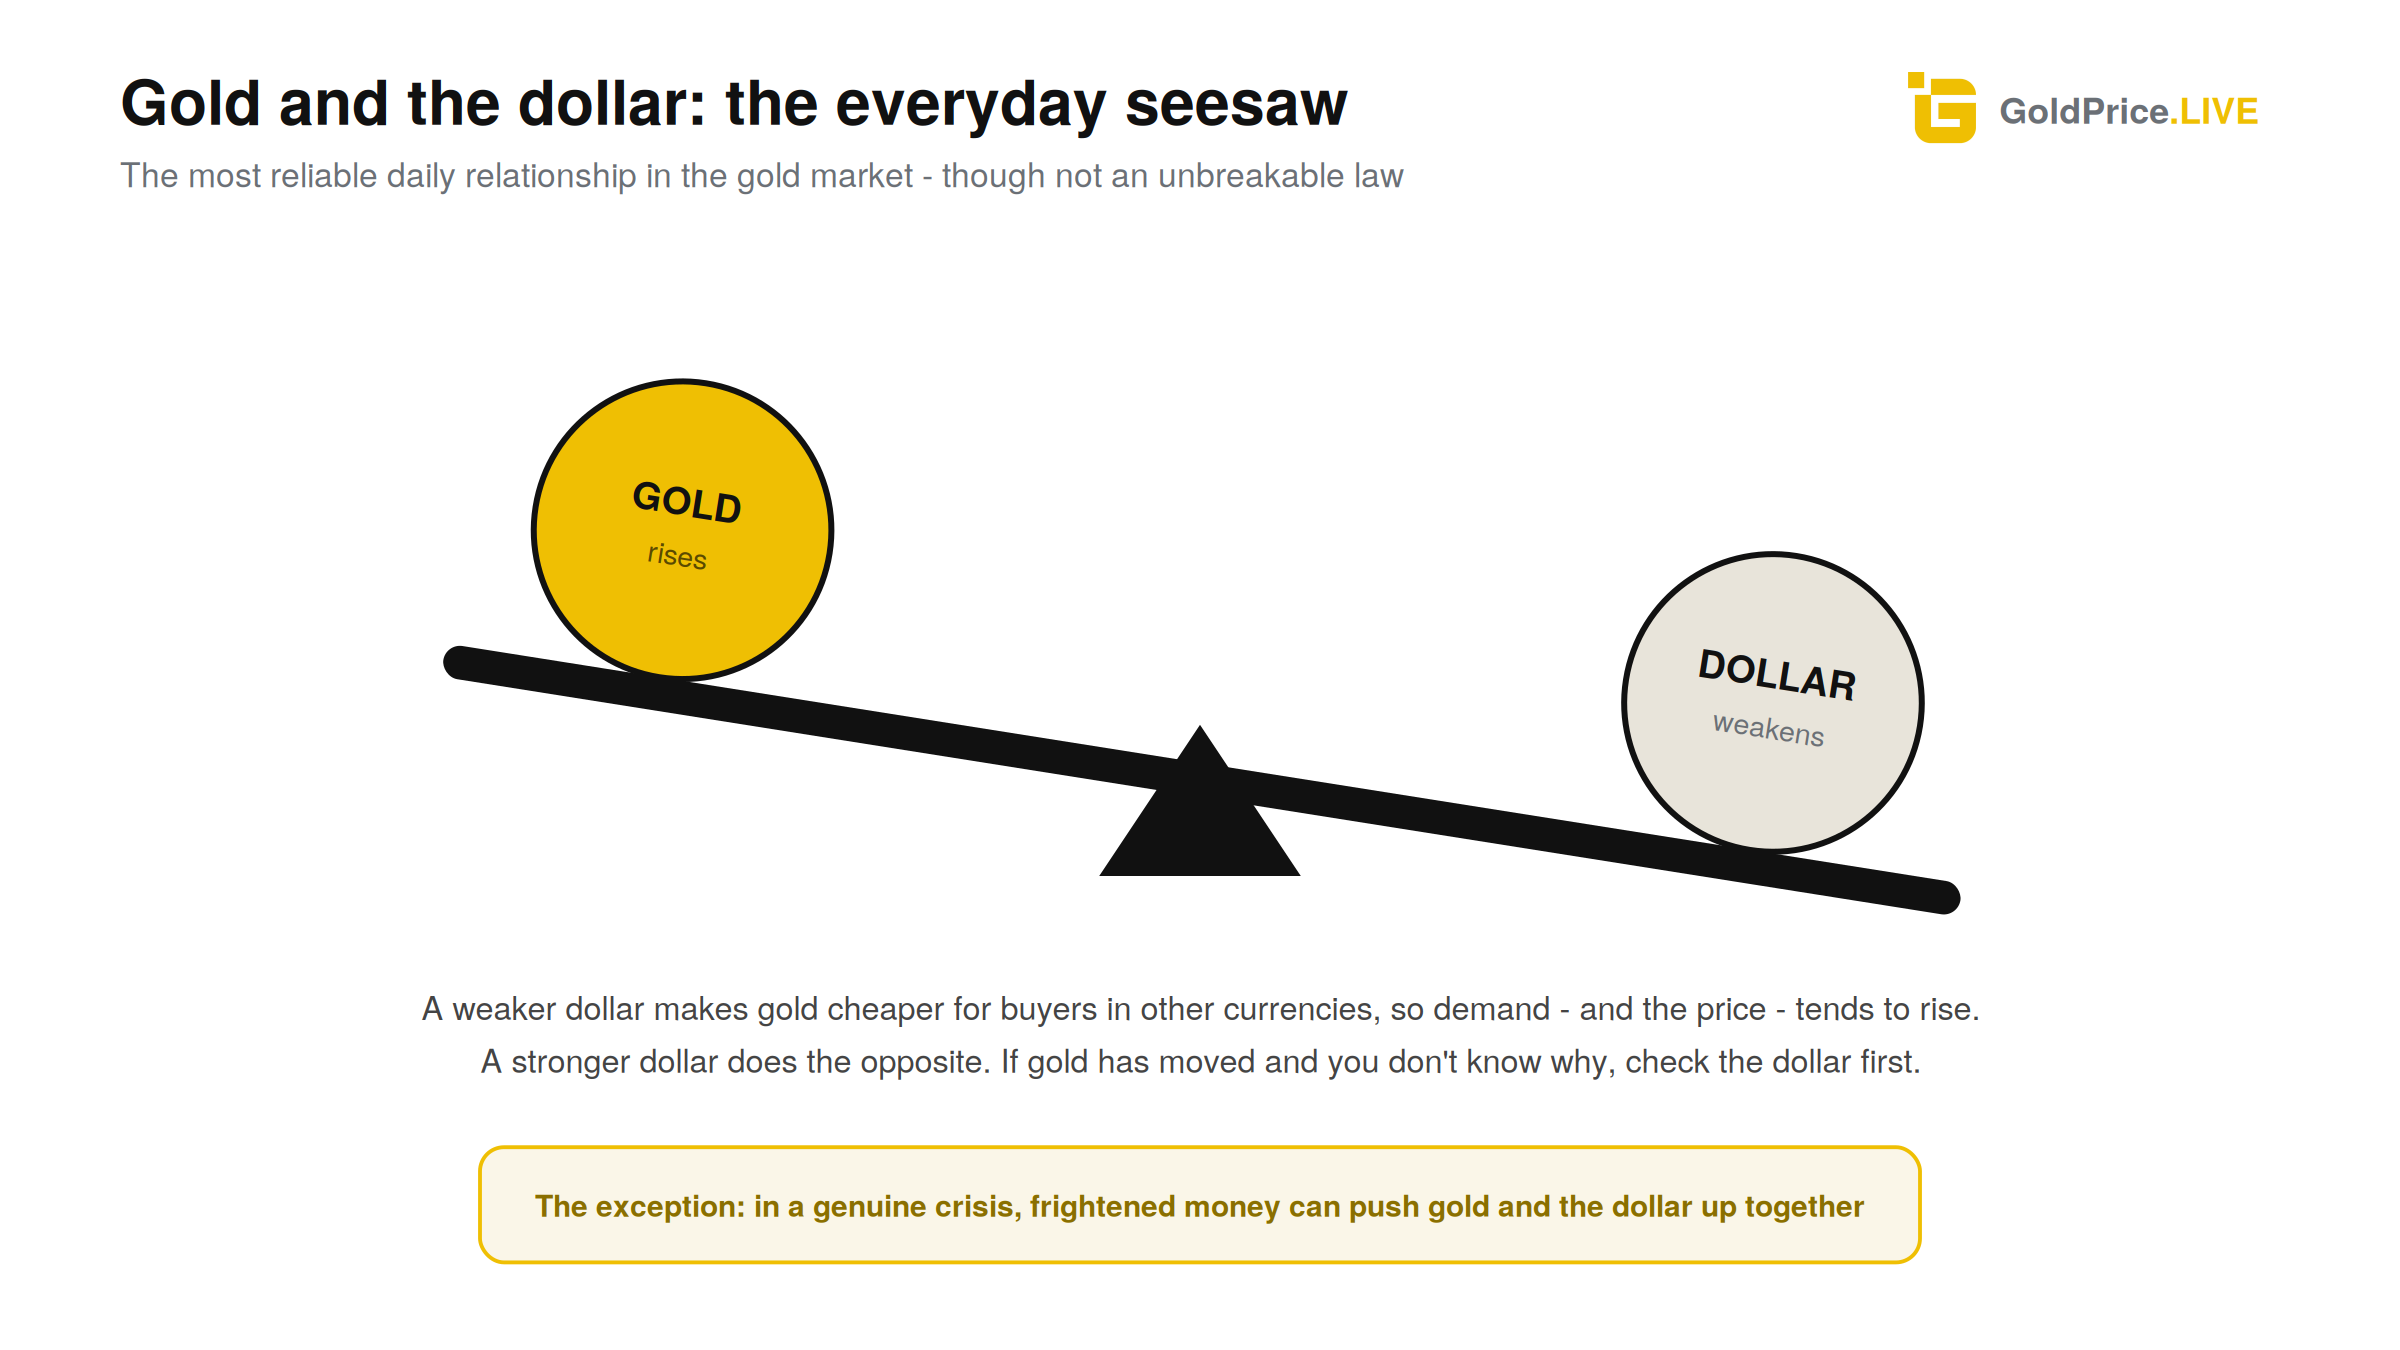
1. The US dollar. Gold is priced in dollars, so the dollar is the lens through which every gold quote passes. When the dollar strengthens, gold gets more expensive for buyers in euros, rupees or yuan, demand softens at the margin, and the dollar price tends to slip. When the dollar weakens, the opposite. It's not a perfect seesaw - both can rise together when investors are nervous enough - but currency fluctuation is the single most reliable daily influence on the gold price. If gold has moved and you don't know why, check the dollar index first. Half the time, that's your answer.
2. Bond yields. Gold pays no interest, which means it's always in a quiet contest with assets that do. The number that matters is the real yield: what government bonds pay after inflation. When real yields rise, holding gold costs you more in forgone interest, and the price tends to sag. When real yields fall - because rates drop or inflation expectations climb - gold's big disadvantage shrinks and the price tends to firm. A surprising amount of gold's day-to-day wiggle is just the bond market thinking out loud.
3. Equities and risk appetite. When stock markets wobble, some money looks for shelter, and gold is the oldest shelter there is. Sharp equity sell-offs often lift gold on the same day. But the relationship has a twist: in a genuine panic, gold sometimes falls alongside everything else for a day or two, because leveraged investors sell whatever they can to raise cash - and gold, being deeply liquid, is easy to sell. It usually recovers first. If you only remember one nuance from this article, make it that one, because it confuses newcomers every time markets get ugly.
4. News and geopolitics. Central bank announcements, inflation figures, elections, conflict, sanctions - anything that changes how safe the world feels or what money will be worth shows up in gold within minutes. US economic data releases are the big scheduled ones: a hotter-than-expected inflation print or a surprise from the Federal Reserve can move gold 1 or 2 percent before lunch. Unscheduled news - the geopolitical kind - is what produces the sudden vertical lines on a chart.
5. Volume and positioning. Markets are crowds, and crowds lean. When futures traders have piled heavily into bets on a rising price, gold becomes vulnerable to sharp air pockets: any wobble forces the most stretched positions to sell, which pushes the price down, which forces more selling. The same works in reverse when everyone's bearish. This is why gold sometimes moves hard on days with no news at all: the market is reacting to itself rather than to the world.
To see how the five interact, walk through an imaginary Wednesday. US inflation data lands at 1:30pm UK time and comes in cooler than expected. Traders immediately price in easier interest rates, so bond yields fall - force two says gold up. Lower rate expectations also soften the dollar - force one agrees, gold up. Equities rally on the same news, trimming the safe-haven bid - force three leans gently the other way. Futures traders who'd bet against gold scramble to close their positions, adding fuel - force five piles in. By teatime gold is up 1.5 percent, and no single cause did it. That's a normal day at the office: several forces reading the same headline and mostly pulling the same direction. The confusing days are the ones where they split the vote.
Notice what's not on the list: mining supply and jewellery demand. They set the deep, slow tides of the market over years. They barely register day to day, because the flow of newly mined metal is tiny next to the volume of existing gold changing hands.
 The overnight effect: why the price is different when you wake up
Check gold at breakfast in Britain and it won't be where you left it at bedtime. While Europe sleeps, Asia trades.
The Asian session has its own character. Volume is typically thinner than during London and New York hours, so the price often drifts in a narrower range - a quiet tide rather than crashing waves. The heaviest action tends to cluster later, when London and New York overlap for a few hours in the afternoon UK time and the big Western economic data lands. That overlap is a small slice of the 24-hour day but carries a hefty share of its volume and, with it, most of the market volatility.
Quiet doesn't mean unimportant, though. Asian hours are when the world's two largest physical gold markets, China and India, do their buying, and the premiums or discounts they pay tell you plenty. Analysts watch the gap between Shanghai's price and London's like a pressure gauge: a fat Shanghai premium means Chinese demand is pulling metal east; a discount means appetite has gone cold. Overnight moves also carry information for the day ahead - gold that climbs steadily through Asian trading often signals physical buying rather than speculative froth, precisely because those hours are usually the calm ones.
So don't write off the morning gap on your chart as noise. It's the readout from a part of the market that does its business while you're asleep.
Seasonal patterns: gold's calendar habits
Zoom out from days to months and a rhythm emerges. I ran the numbers across our full daily dataset back to 1970, and a few patterns stand out.
January is gold's happiest month, averaging a gain of about 2 percent across the past half century or more, and it's been even stronger this century. February and the late summer stretch of August and September have historically leaned positive too. At the other end, March and June are the classic soft patches - June being the heart of what old hands call the summer doldrums.
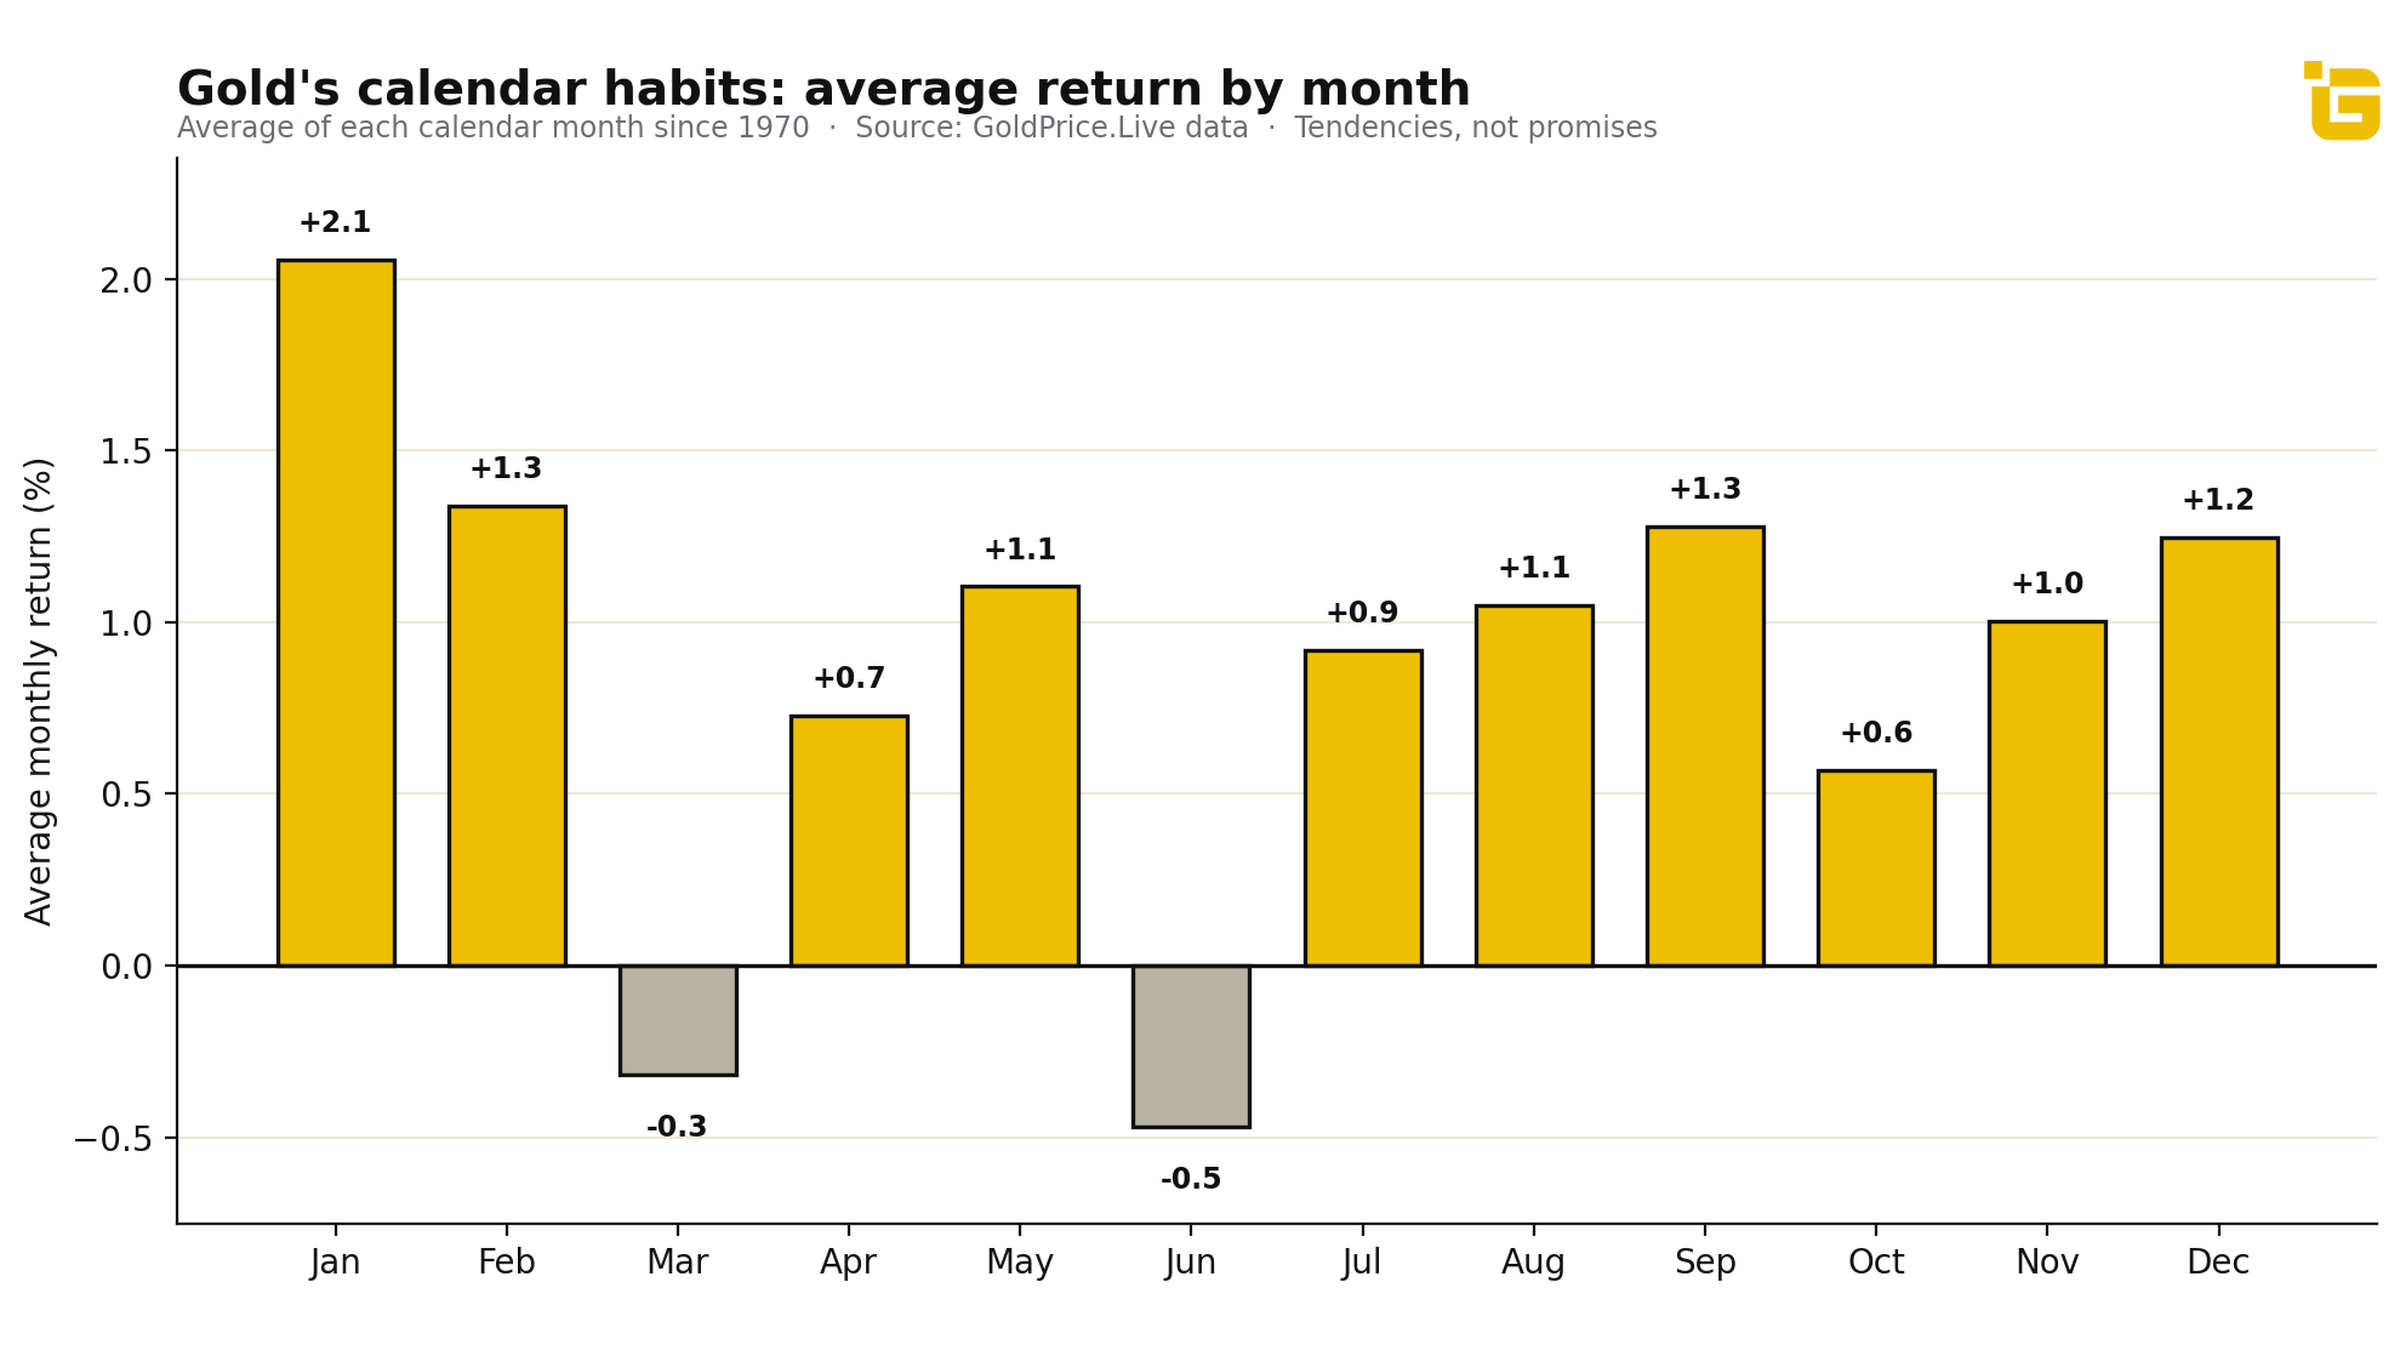
There are real-world reasons for these rhythms. Gold demand has a festival calendar: Indian weddings cluster in the autumn and winter months, Diwali is one of the biggest gold-buying occasions on earth, and Chinese New Year in January or February drives a wave of gifting and jewellery purchases. Jewellers stock up ahead of all of it, and that physical pull shows through, faintly, in the price. The folklore usually crowns September as gold's best month, courtesy of Indian wedding season stocking, Diwali ahead, and jewellers rebuilding inventories. The long-run data gives September a respectable showing, but in recent decades January has clearly taken the crown - helped by new-year investment flows, Chinese New Year buying, and fund managers rebalancing into fresh allocations.
Two honest caveats. First, these are averages across dozens of years; any individual January can be a stinker, and June occasionally roars. Second, seasonal edges in gold are measured in fractions of a percent and are dwarfed by whatever the dollar, the Fed or world events are doing that year. Treat the calendar as a gentle lean in the probabilities, never a timing system. Anyone selling you a gold strategy built mainly on the month is selling you something flimsy.
How to read a daily gold chart
All of which brings us to the practical bit: you look up the gold price change today and see it's moved. What do you do with that?
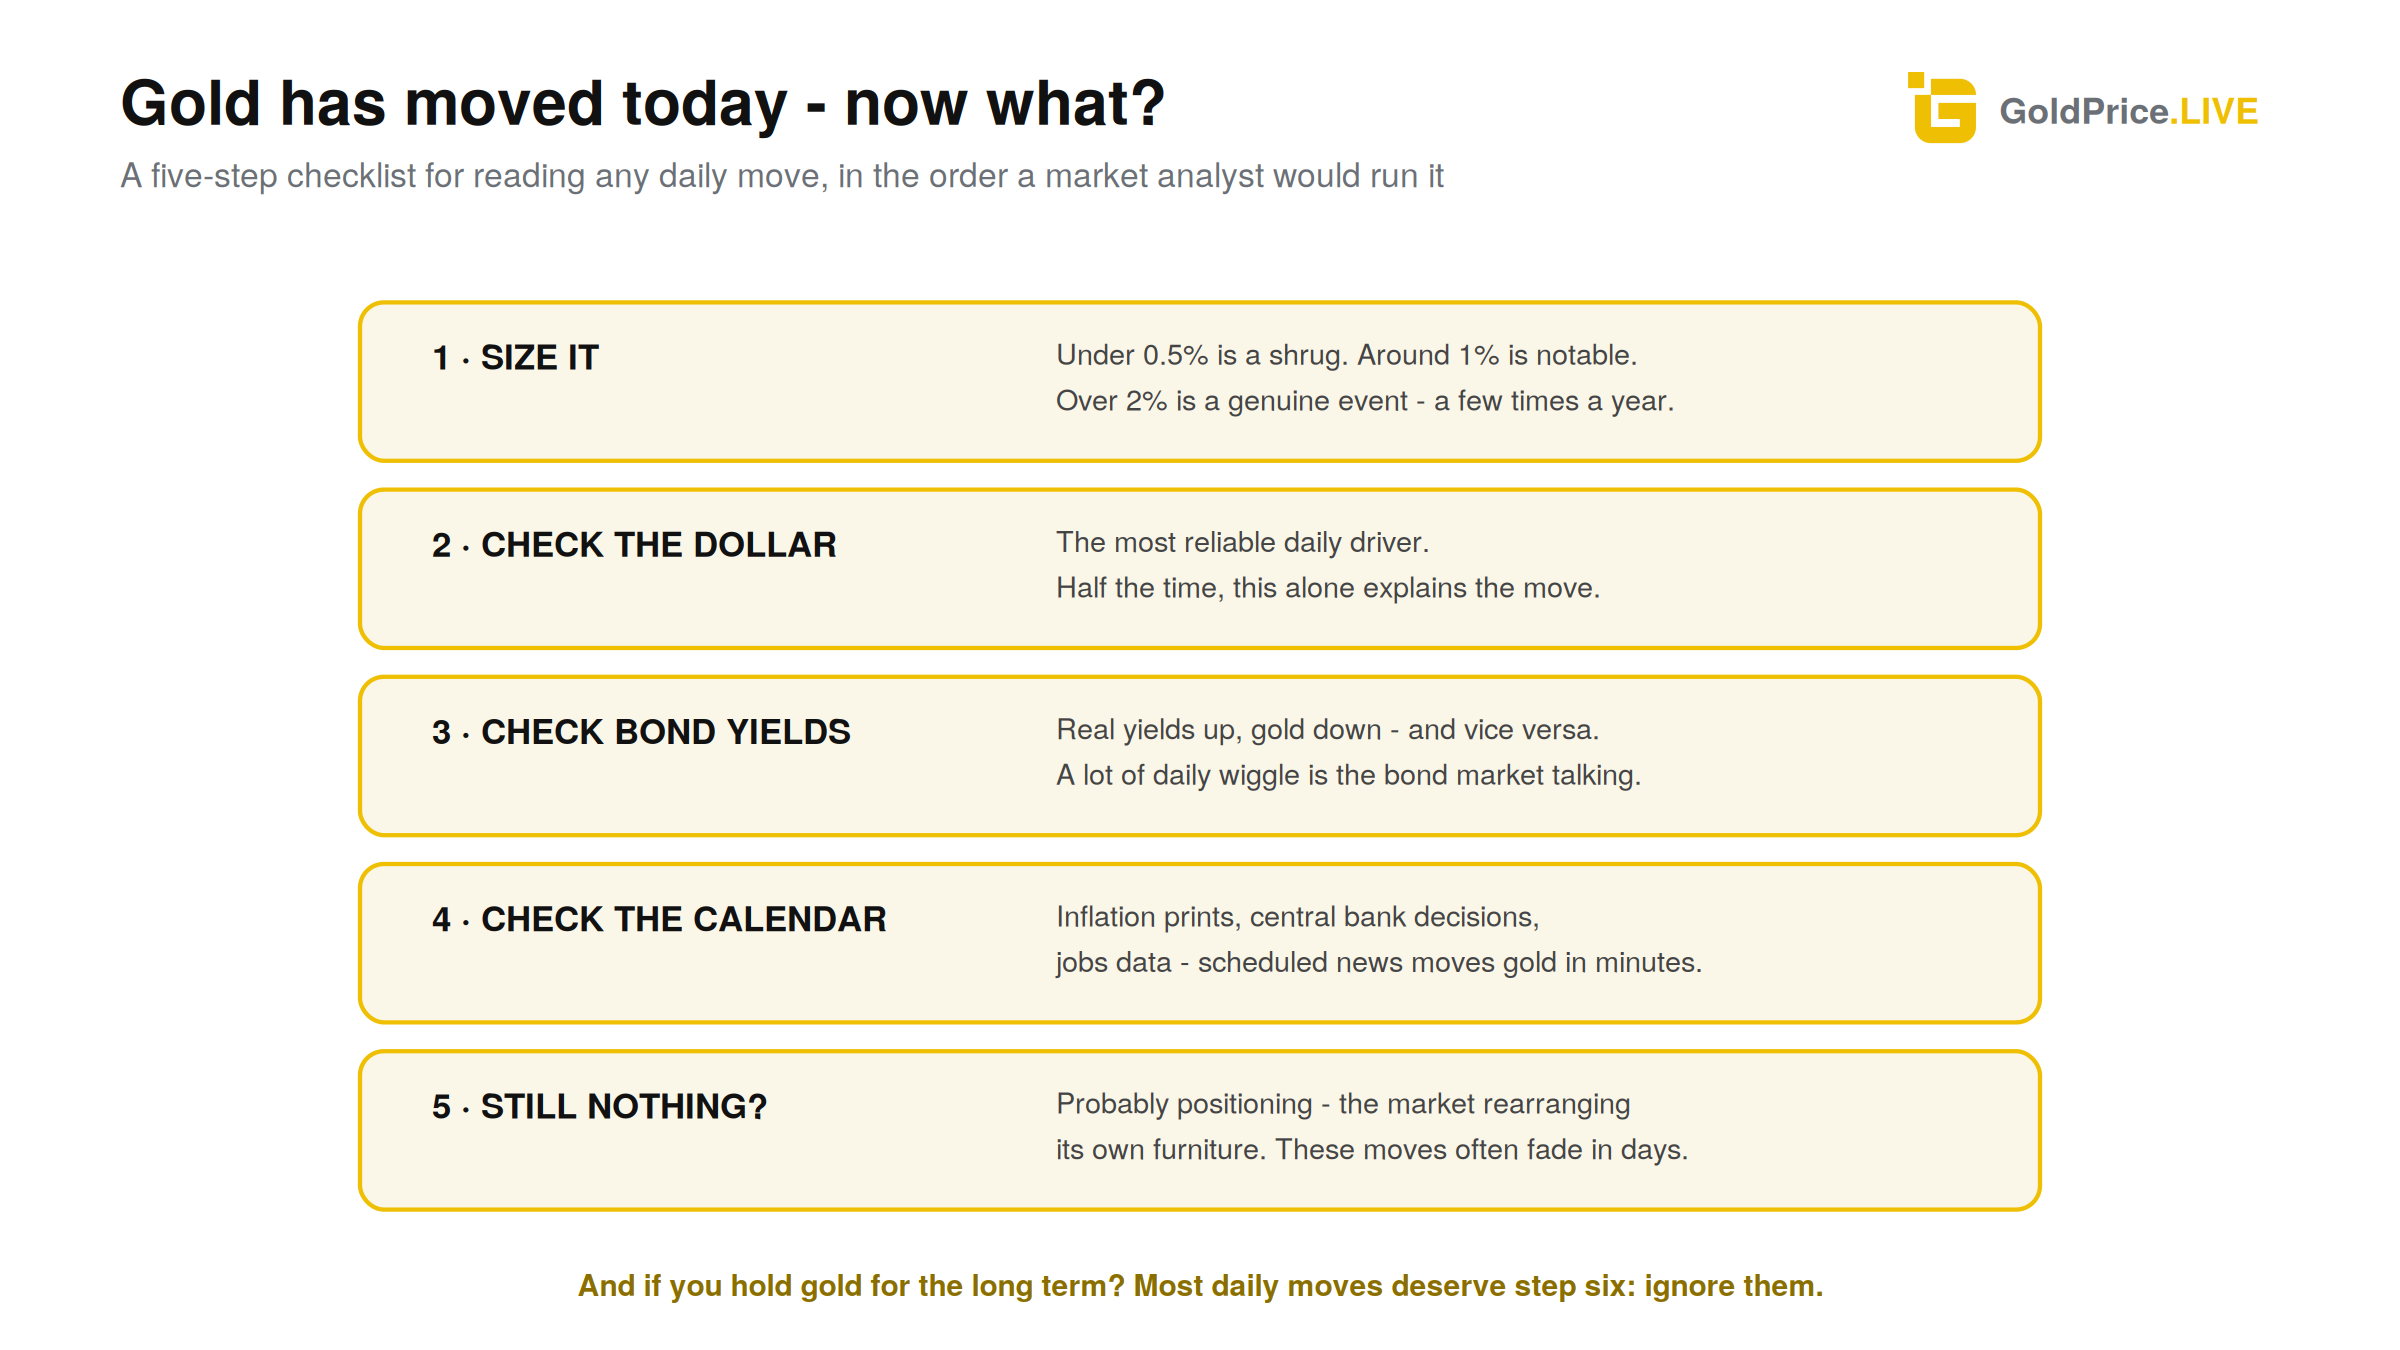
First, size the move before you interpret it. Against gold's usual half-a-percent day, a 0.3 percent move is a shrug - don't waste time hunting for its cause. A 1 percent move is notable. Two percent or more happens only a handful of times a year outside crisis periods, and almost always has a nameable trigger.
Second, run the checklist in order. What did the dollar do? What did bond yields do? Was there scheduled economic data? Any geopolitical headline? If all four come up empty, you're probably looking at positioning - the market rearranging its own furniture - and those moves often retrace within days.
Third, mind your timeframe. Most price charts draw each day as a candle: a bar running from the day's opening price to its close, with thin wicks marking the highest and lowest points the price touched along the way. A long wick with a small body says the price ventured somewhere and got rejected; a tall solid body says conviction. Useful vocabulary, but keep it in proportion. A daily candle tells you what traders did in one session; it tells you almost nothing about where gold is going. Weekly and monthly charts filter the noise and show the trend. And for anything spanning decades, insist on a log scale, where a move from $400 to $800 looks the same size as $2,000 to $4,000 - because in percentage terms, it is. On a standard scale, old history flattens into a misleading crawl along the bottom.
Last, remember what the chart is for. If you hold gold as long-term insurance, the honest answer to most daily moves is to ignore them. The restlessness you see on screen is the market doing its job - digesting every scrap of information the world produces, around the clock, and settling on a price. Why does gold price fluctuate day after day? Because the world it measures never sits still either. Learn to read the wiggles for what they are, and they lose their power to alarm.
Founder of GoldPrice.Live and GoldBuzz.com. Passionate about gold and silver. Designed the 4-year Theseus research project. Ex-British Aerospace and Scotland Yard, now based in Canada.