



 By Rick Adams•September 30, 2026
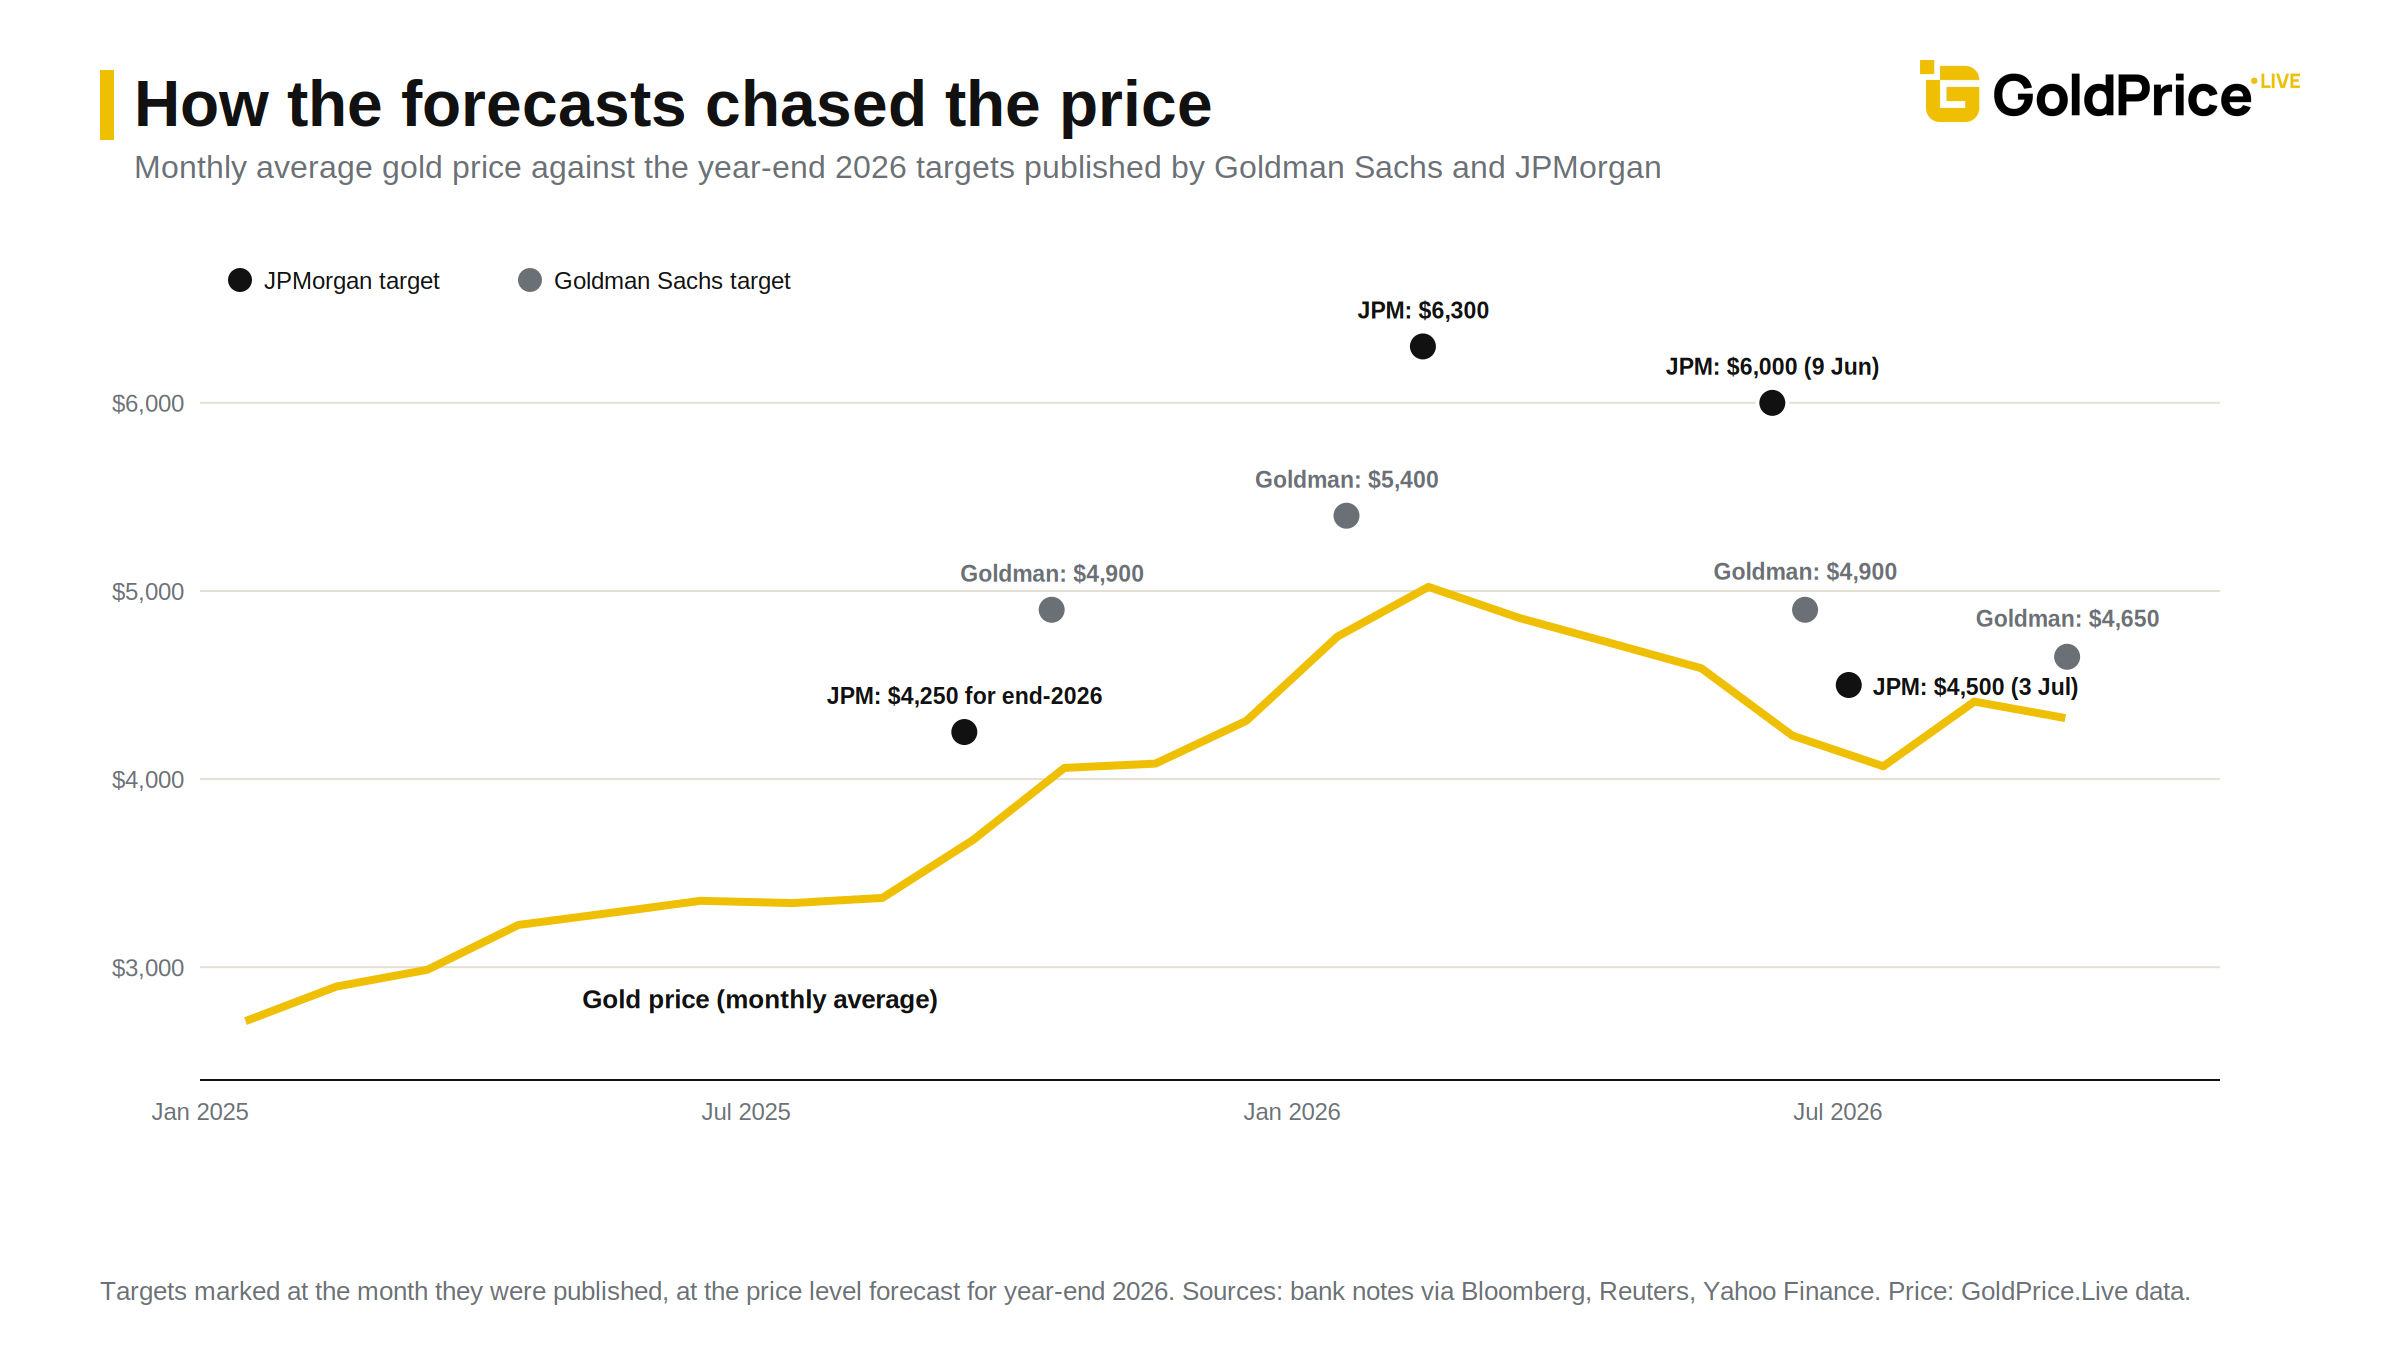
Every gold price prediction you'll read this year, including the ones in this article, comes with a health warning I'd like you to take seriously: the people making them were spectacularly wrong twelve months ago. In September 2025, JPMorgan's analysts thought gold might reach $4,250 by the end of 2026. Goldman Sachs had $4,000 pencilled in for mid-2026. Gold blew through both numbers by December 2025 and touched a record near $5,600 in January 2026. Then the same banks chased it up to $6,000 and beyond, and then cut those targets by a quarter when the price fell.
So this piece isn't a crystal ball. What I've done is gather what the major desks are actually saying as I write, explain the mechanisms behind their numbers, and lay out bull, base and bear scenarios for 2027 to 2030 that you can check against the price yourself. Where I give my own view, I'll say so. This is a year-dated article and I refresh it each January, so the forecasts below are the late-2026 readings.
The story of the 2026 gold price forecast is a story of whiplash. Coming into the year, most banks had targets in the mid-$4,000s. When gold ran to $5,600 in January, they scrambled higher: Goldman Sachs raised its year-end call to $5,400, JPMorgan went to $6,300, and Wells Fargo and Bank of America both talked about $6,000. Then the market turned. Inflation stayed sticky, the Fed stopped talking about cuts, and gold fell roughly a quarter from its peak, briefly dipping below $4,000 in late June.
The forecasts followed the price down. JPMorgan told clients on 9 June that gold would hit $6,000 by year-end; on 3 July it cut that to $4,500. Goldman trimmed to $4,900 in June and again to $4,650 after the Fed's September rate rise. Bank of America cut its full-year average to about $4,360. Only UBS and Citi have nudged their numbers back up since the summer lows.
There's a lesson in that sequence, and it's the most useful thing in this article. Bank forecasts trail the price. They are marked to market like everyone else's opinions, which makes them a decent guide to where the consensus sits today and a poor guide to where the price goes next. Treat every analyst forecast as a statement of current sentiment, not a prophecy.
As of late September 2026, the major year-end targets cluster tightly. JPMorgan and Citi are at $4,500 for the fourth quarter. UBS is at $4,600. Goldman Sachs is at $4,650. Bank of America's quarterly figure is around $4,600, with a stated floor nearer $3,900. Commerzbank and Morgan Stanley sit at roughly $4,800. Put those together and you get a consensus range of about $4,400 to $4,900 for the end of 2026, with the price sitting in the low-to-mid $4,000s as I write.
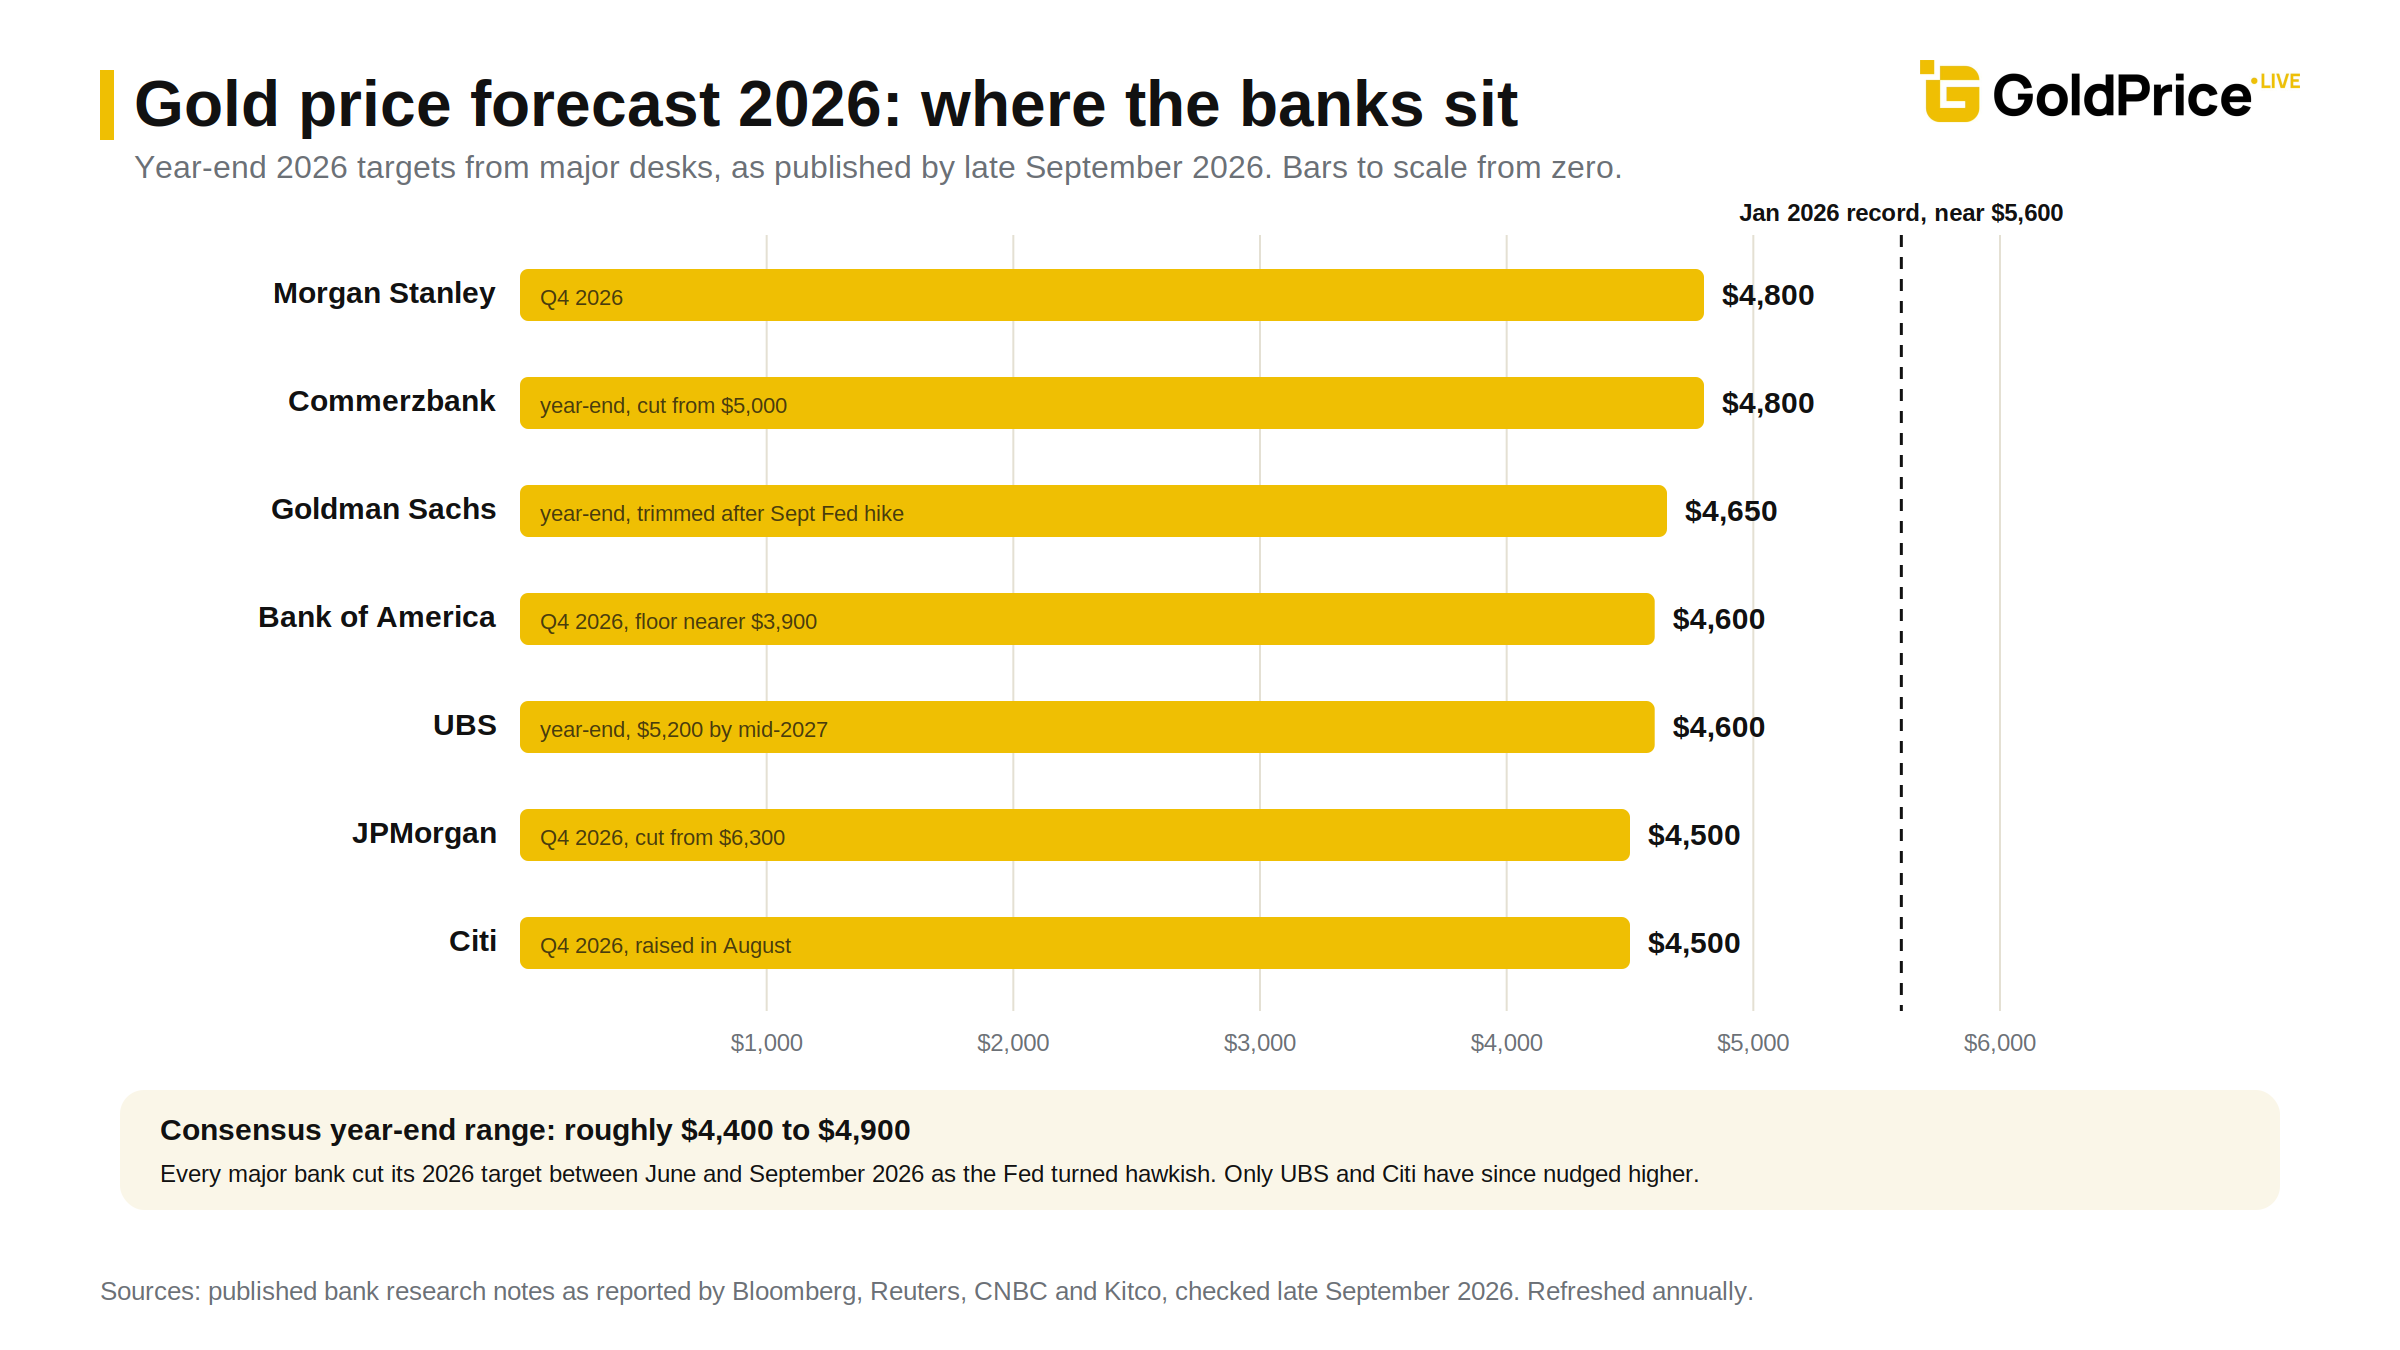 So will gold go up in 2026? On a full-year basis it already has, marginally, since it started the year around $4,300. On a year-end basis, the consensus implies a modest gain from current levels and nothing like a return to the January record. That's a change from the euphoria of the spring, and it rests on one thing above all: the Federal Reserve.
The Fed raised rates in September for the first time since 2023, taking the funds rate to 3.75 to 4%, and its own projections point to at least one more increase before year-end. The 10-year Treasury yield has been trading around 5%. That's the headwind. JPMorgan has put a number on it: since late February, gold has dropped about $20 an ounce for every one basis point rise in the 10-year real yield. When real yields rise, gold falls. It really is that simple in the short run.
What's holding the price up against that headwind is central bank demand. The World Gold Council reported 289 tonnes of official buying in the second quarter of 2026, a record for any second quarter, led by Poland and China. The Goldman Sachs gold forecast credits that buying with almost all of its expected upside: the bank estimates official purchases are running at around 90 tonnes a month against a pre-2022 average of 17. Take the central banks away and you'd have a much weaker market.
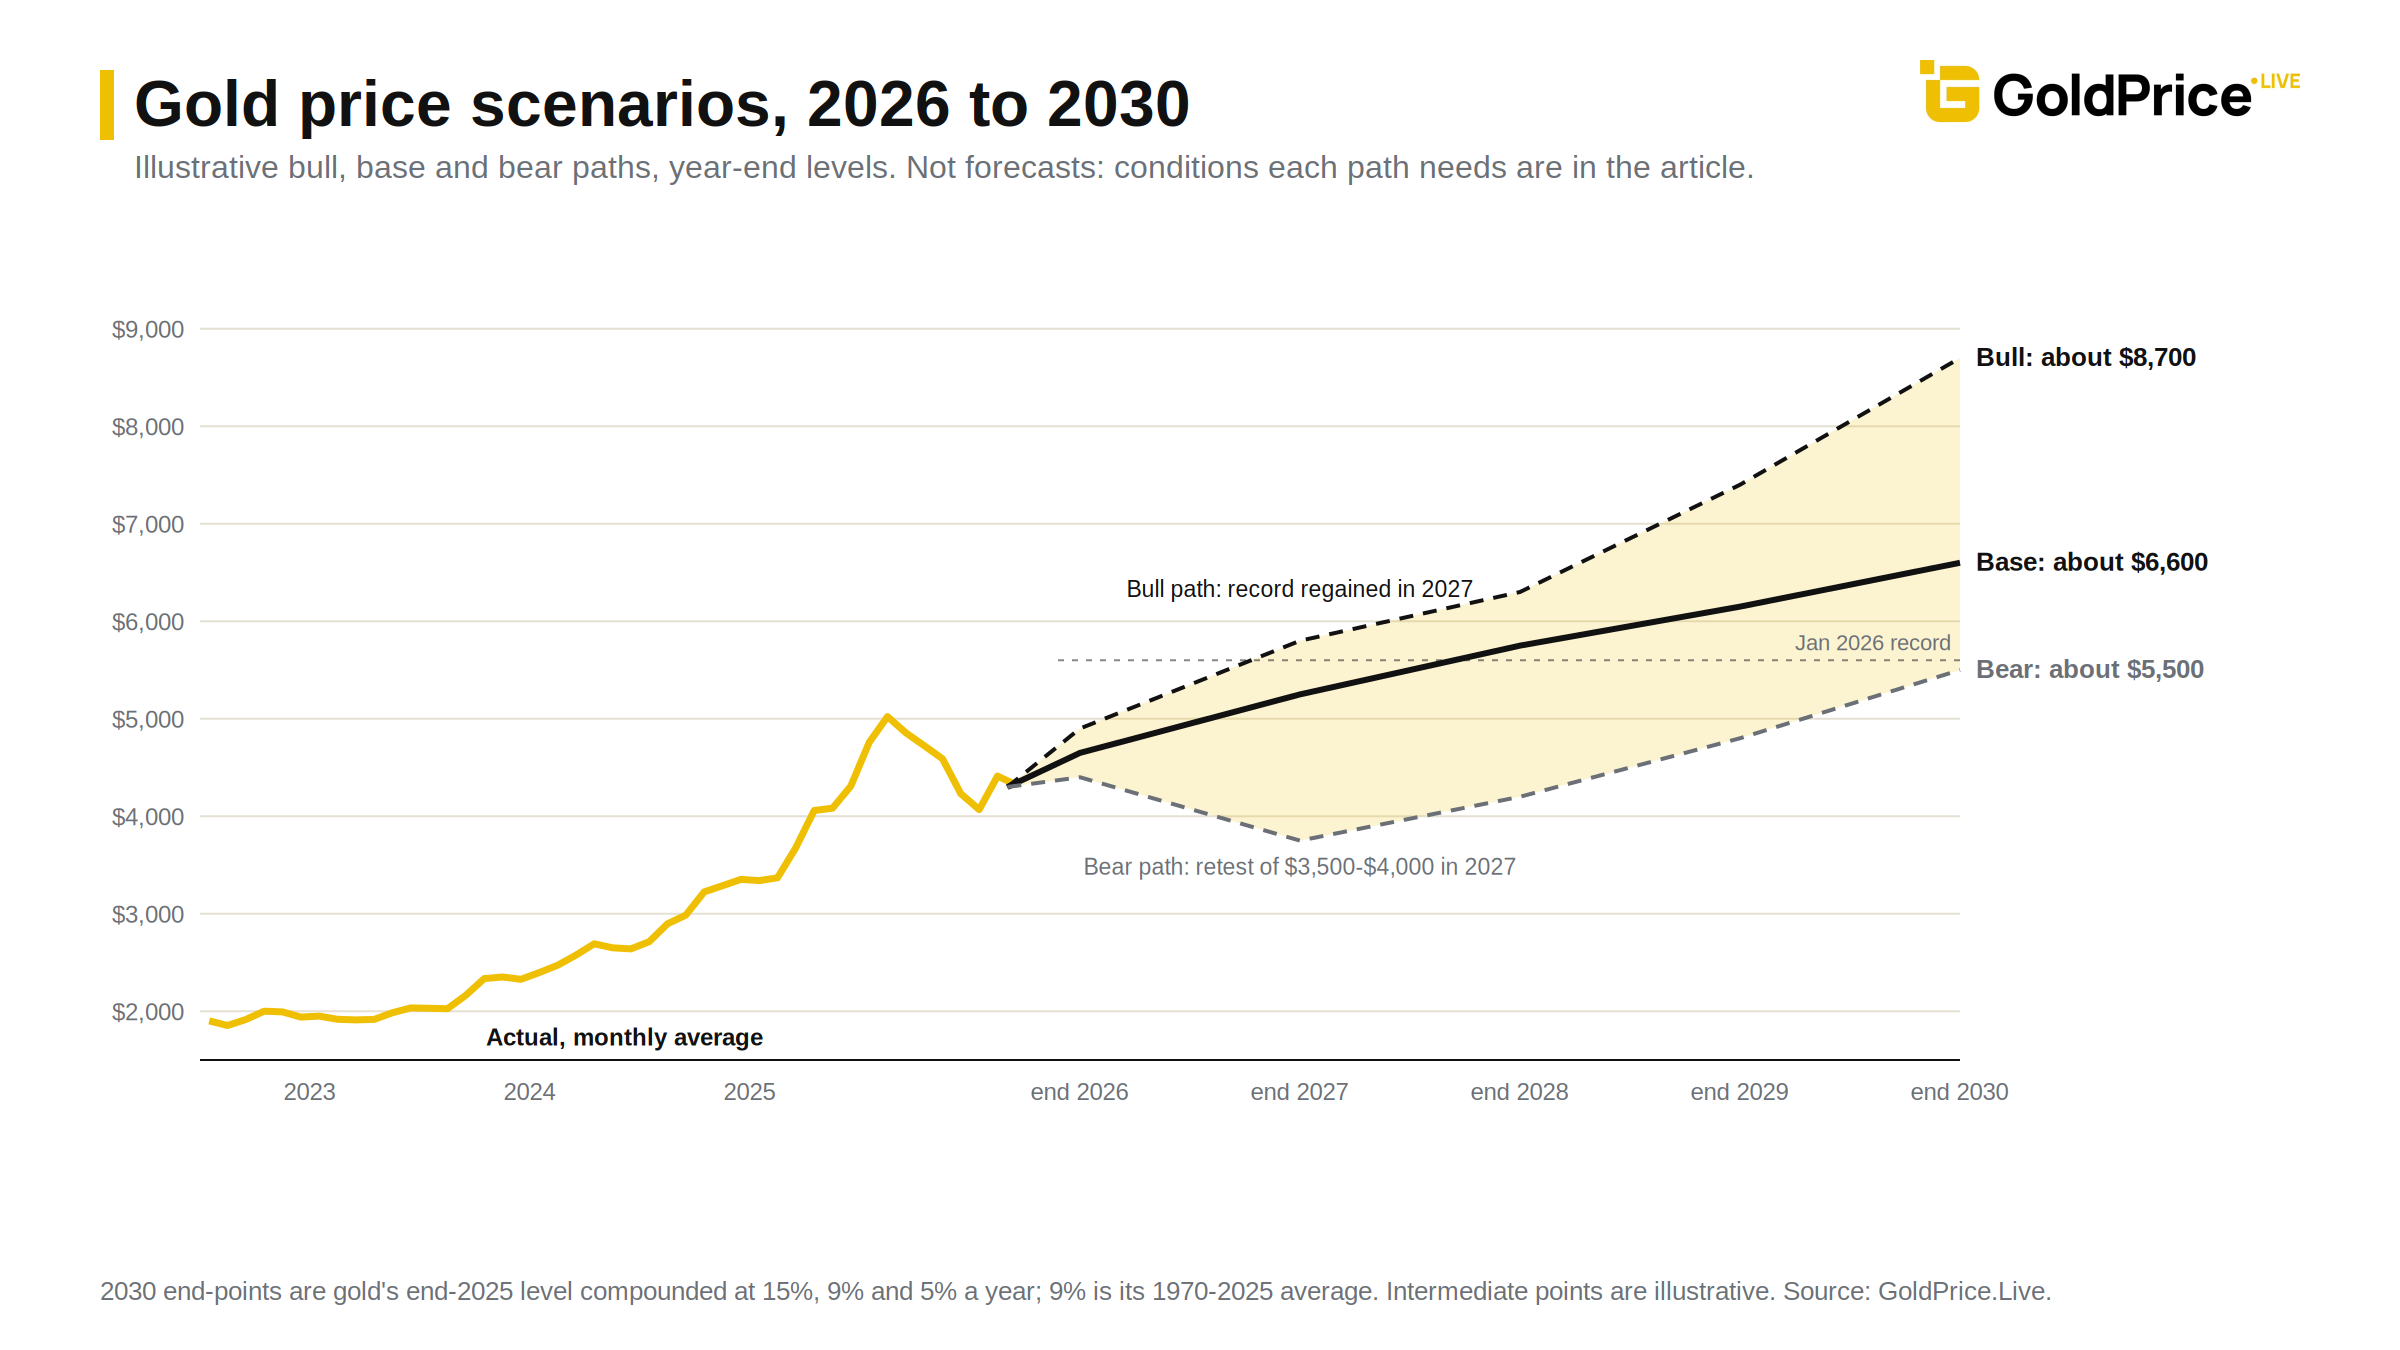
Beyond a year out, the banks stop publishing precise targets and start publishing scenarios, which is more honest. Their 2027 numbers currently sit between $5,000 and $5,400: Citi has $5,000 for the first half, UBS $5,200 by mid-year rising to $5,400 by September, and both Goldman Sachs and JPMorgan land on $5,400 for the end of 2027. Bank of America's "extreme demand" case reaches $8,000 by 2027, but even BofA calls that a tail scenario rather than a base case.
I find it more useful to think in three paths, each tied to a specific set of conditions you can watch for.
The bull case: $6,000 to $6,500 by 2028. This needs the Fed to reverse course. If inflation cools enough for rate cuts to resume in 2027, real yields fall, the dollar weakens and Western investors come back through the ETFs. JPMorgan's original 2026 target of $6,000 was built on exactly this mix. Add sustained central bank buying near 1,000 tonnes a year and a new record above the January 2026 high is very plausible by 2027, with $6,000 or more in 2028.
The base case: $5,000 to $5,500 by end-2027, mid-$5,000s to $6,000 in 2028. This is roughly where the banks are, and it assumes the Fed holds rates near 4% through 2027, central banks buy somewhere between 800 and 1,000 tonnes a year, and ETF flows are neutral. Gold grinds higher on official demand alone, as Goldman puts it, with the January 2026 record regained sometime in 2027.
The bear case: a retest of $4,000 and possibly $3,500 in 2027. This needs inflation to stay sticky, the Fed to keep hiking into 2027, real yields to keep climbing and ETF outflows to persist. North American ETFs had their weakest first half since 2013 in 2026, so the selling has already started. BofA's $3,900 floor and the $3,500 level that several desks quote as a bear target mark out the downside. It's worth remembering that 2013 to 2015 took 45% off the price; a 30% to 40% fall from the January peak is not unthinkable.
My own view, for what it's worth, is the base case with a bull tilt. The Fed rarely hikes for long when the 10-year is already at 5% and the economy is carrying record debt. The bigger uncertainty is timing, not direction.
A gold price target 2030 is really a bet on five slow-moving forces. None of them turns on a Fed meeting.
Central bank reserve diversification. Official buying topped 1,000 tonnes in each of 2022, 2023 and 2024, and 2025 set another record. The World Gold Council's 2025 survey found 95% of central banks expect global gold reserves to rise over the following year, and none expected their own to fall. The People's Bank of China has now added to reserves for 20 consecutive months. The driver is the 2022 freezing of Russia's dollar reserves: gold is the only reserve asset nobody can sanction. This doesn't reverse quickly.
Fiscal deficits and debt. The US is running large deficits with a 10-year yield near 5%, which means interest costs compound. Every bank forecast I've read cites this. Gold has become a debasement hedge as much as a crisis hedge.
Flat mine supply. Mine production grew 2% year on year in the second quarter of 2026, and the WGC expects only modest growth from mines and recycling. Total supply was roughly 1,270 tonnes in the quarter, and demand absorbed all of it. New discoveries are scarce and take a decade to bring on.
Under-owned by institutions. Bank of America's Michael Widmer has pointed out that investor allocations to gold remain historically low. JPMorgan's $8,000 upside scenario for 2030 hinges on private investors lifting allocations, not on central banks.
Asian retail demand. Chinese and Indian buying held up through the 2026 correction, with Indian spending on gold hitting a second-quarter record in rupee terms even as tonnage fell.
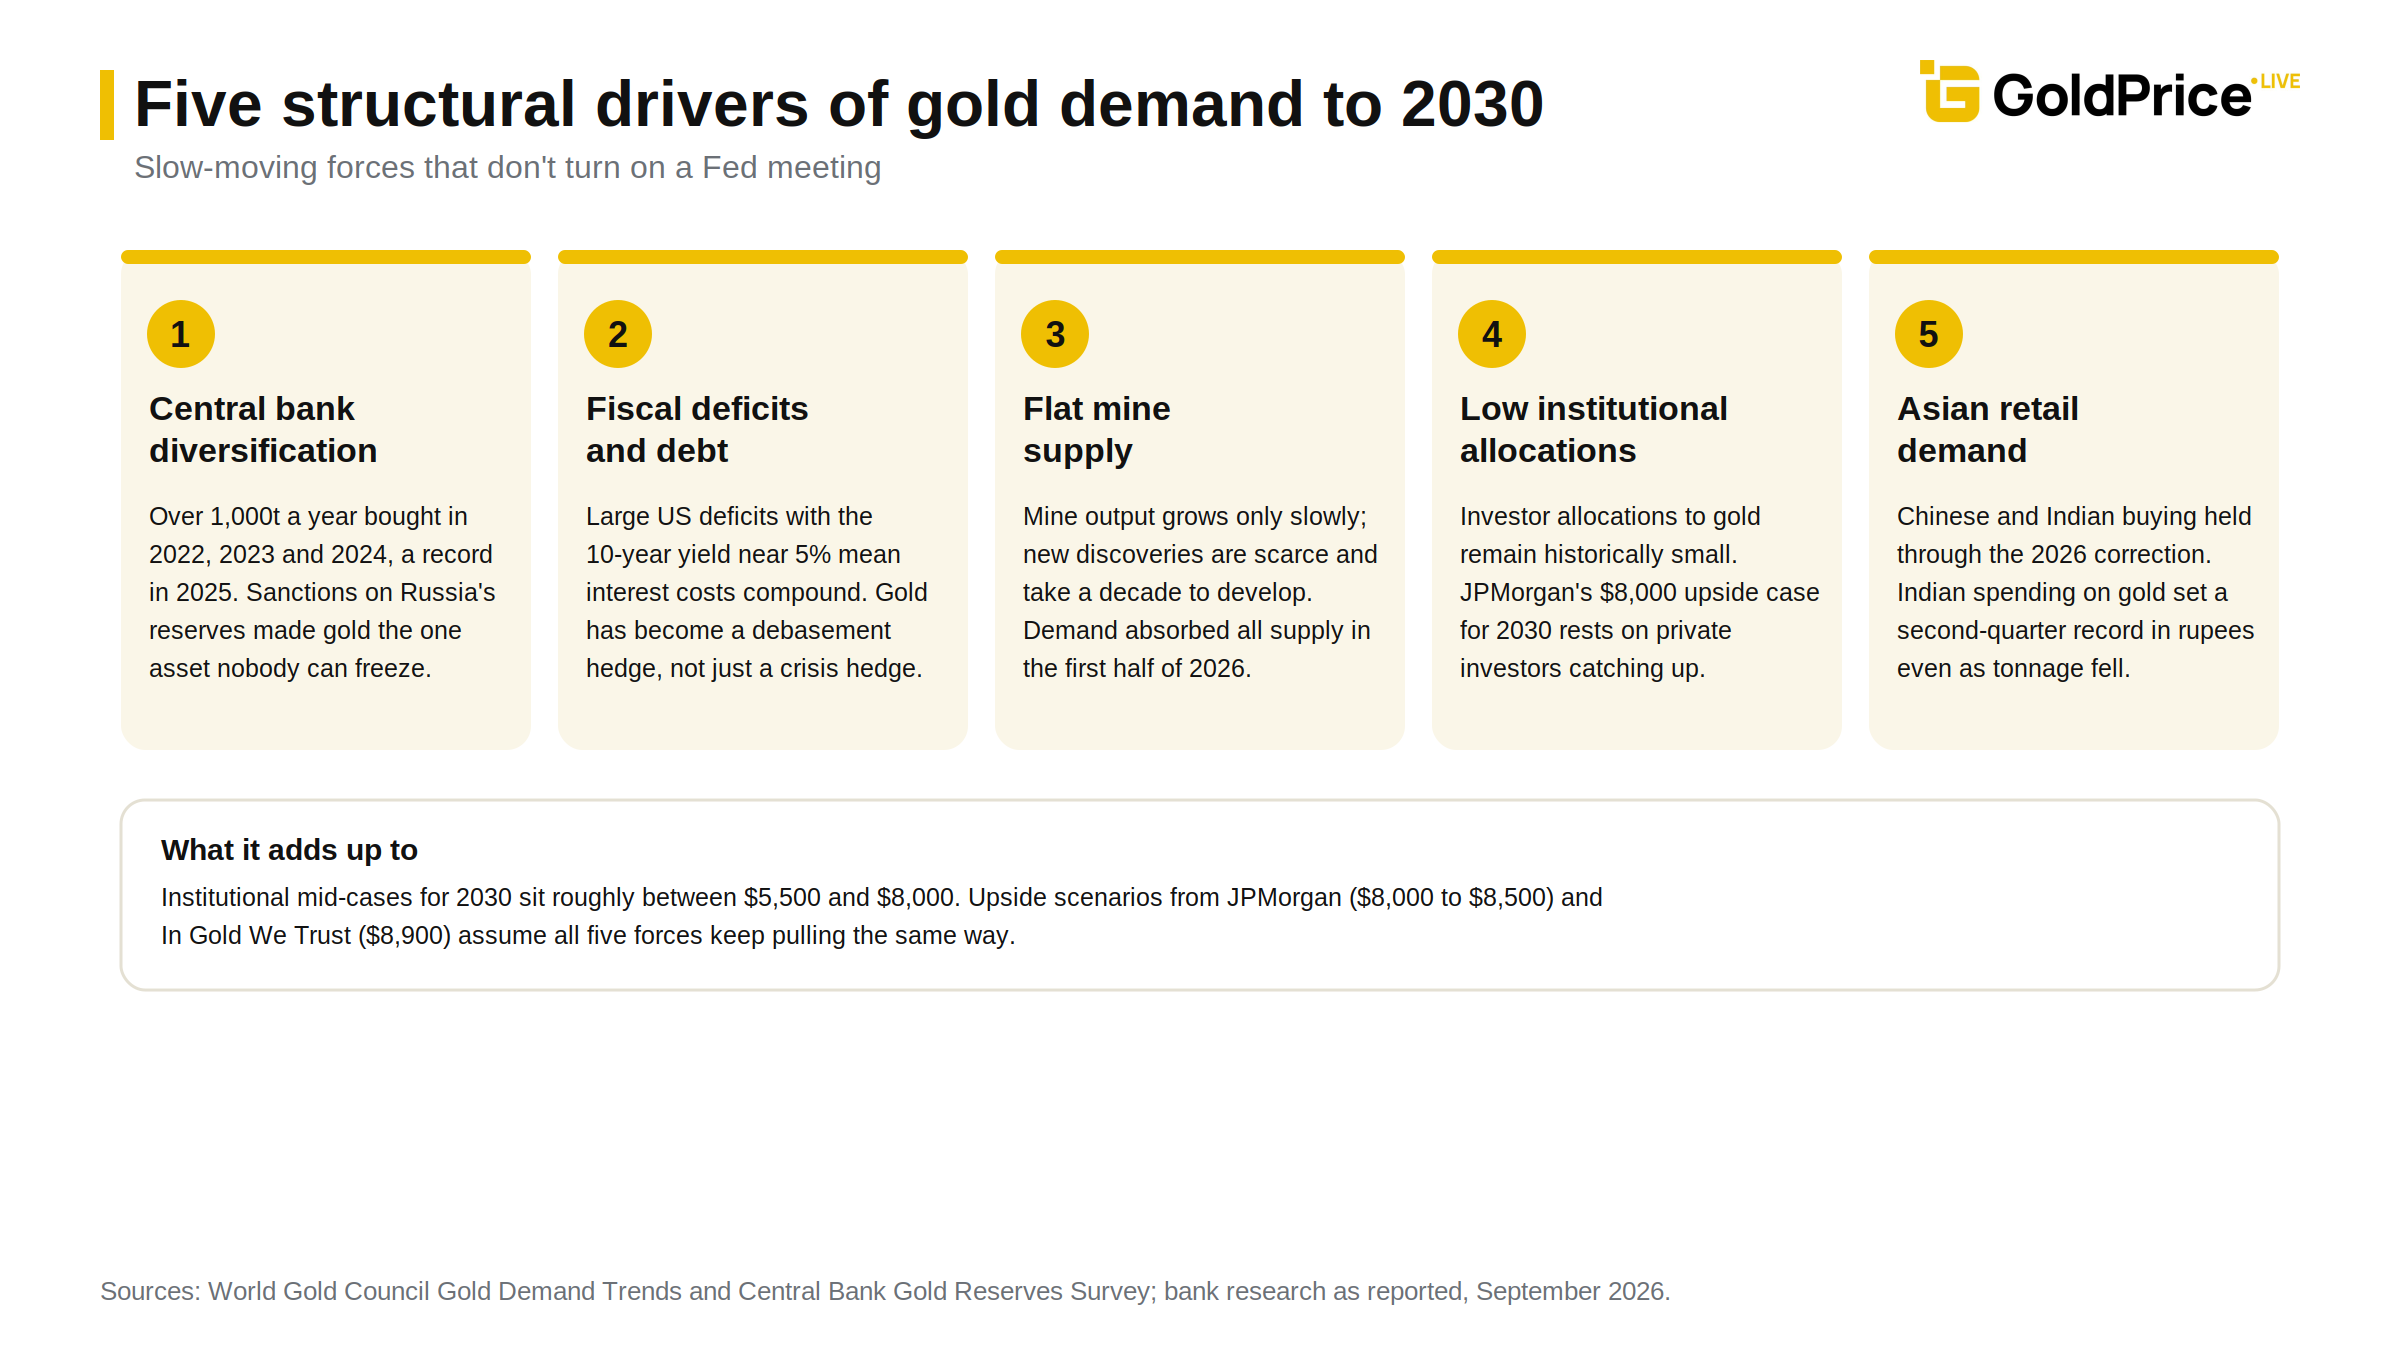
Where does that leave the 2030 numbers? JPMorgan has modelled $8,000 to $8,500 by the end of the decade as an upside case. The In Gold We Trust report targets $8,900, and its authors note their 2020 base case of $4,800 by 2030 was reached five years early. The mainstream institutional mid-case sits in the $5,500 to $8,000 band.
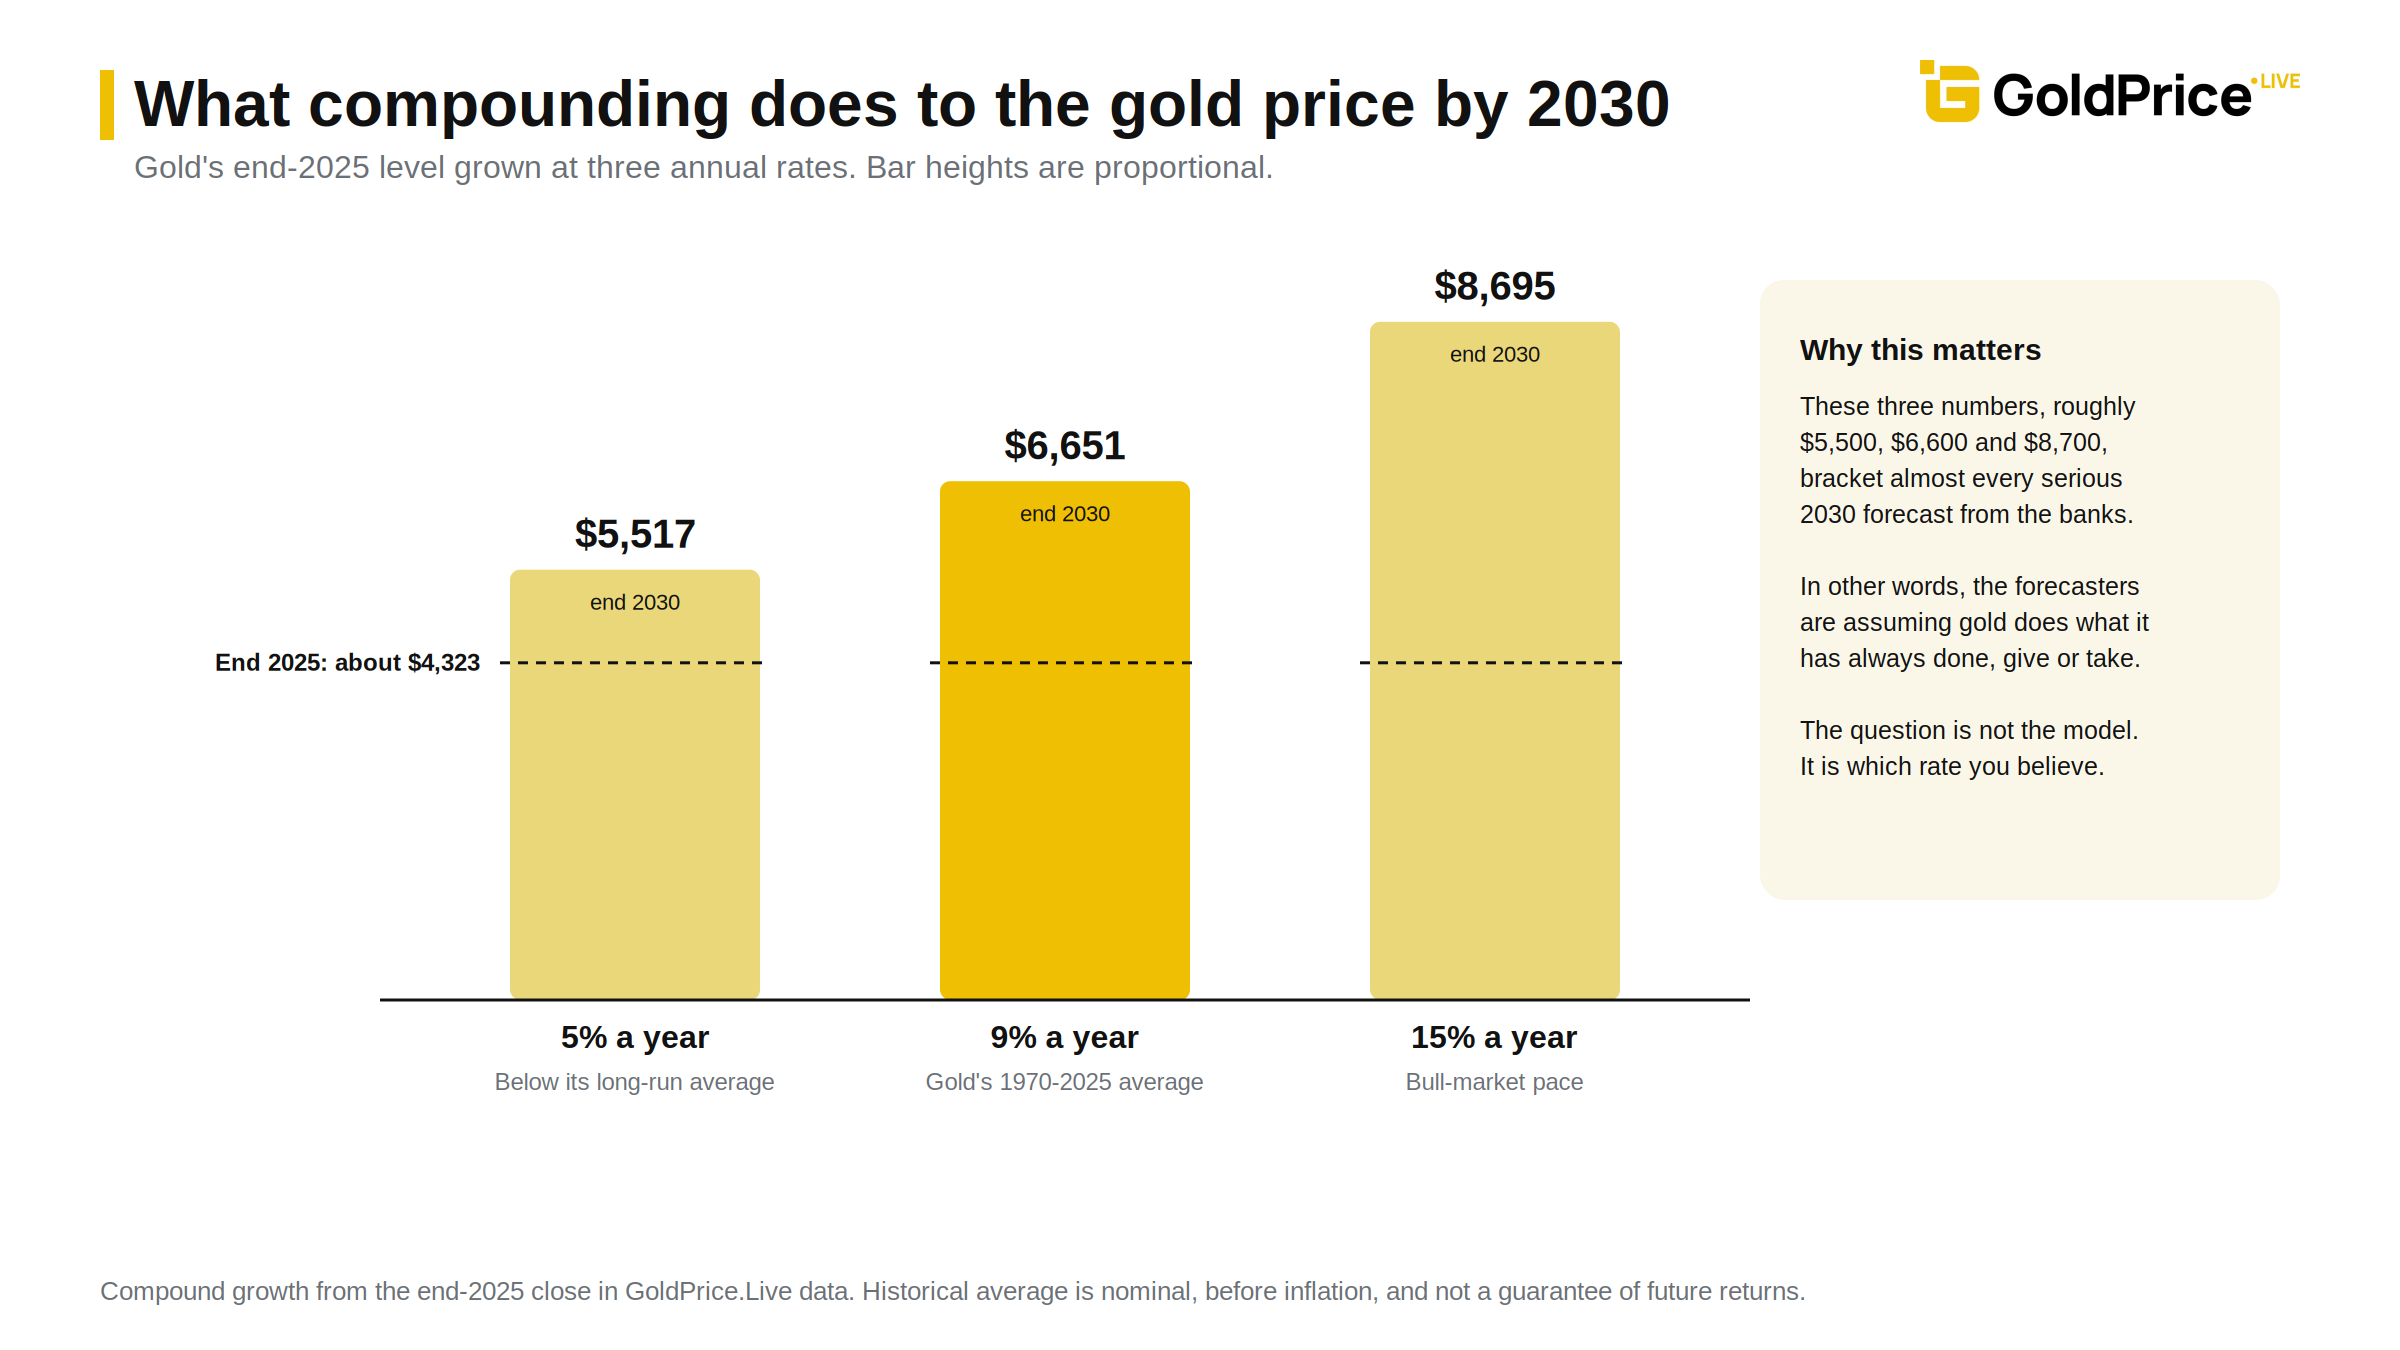
Here's my simple arithmetic, which I trust more than any model. Gold ended 2025 a little above $4,300. Its long-run compound growth rate since 1970, from our own price data, is about 9% a year. Run that forward five years and you get roughly $6,600 by the end of 2030. At 5% a year you'd get about $5,500; at 15% you'd get about $8,700. Those three numbers bracket every serious 2030 forecast I've seen, which tells you the banks are essentially assuming gold does what it's always done, give or take.
 What pushes gold higher, and why $3,500 matters
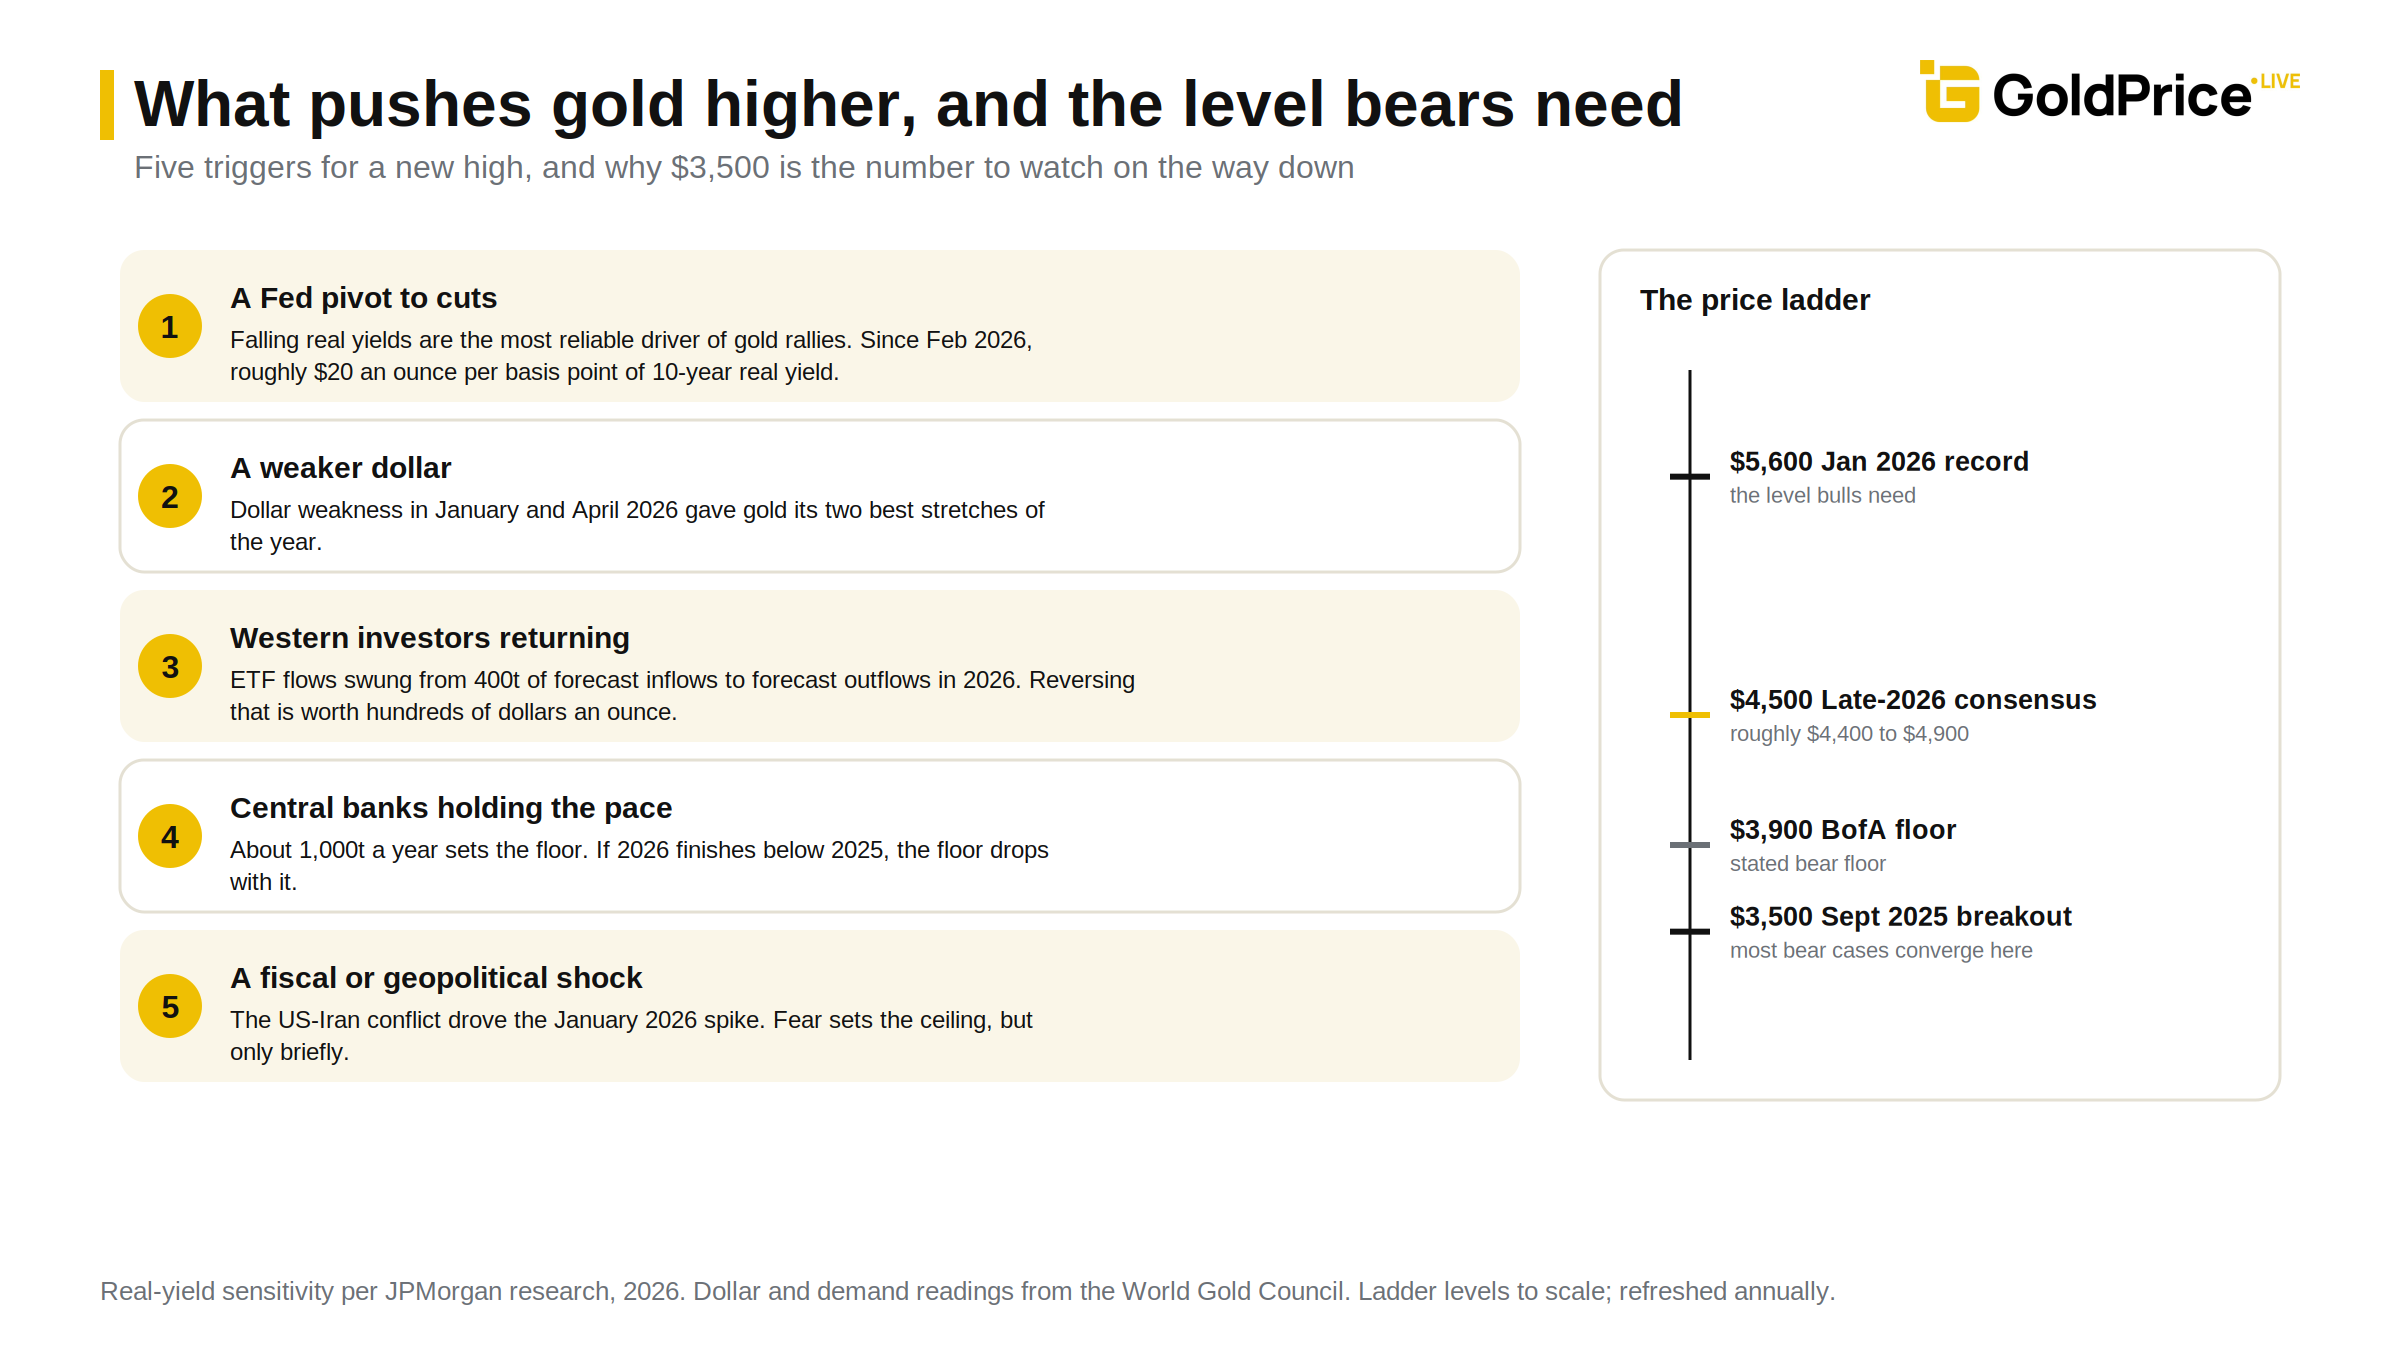
The January 2026 record near $5,600 is the level the bulls need. Getting back above it requires some combination of five triggers.
On the way down, $3,500 is the number to watch. It's where gold broke out in September 2025 after five months stuck between $3,200 and $3,450, and it's the level most bear cases converge on. If gold holds above it through the current tightening cycle, the structural story is intact and the correction is a pause. If it breaks, the 2025 rally starts to look like the 1980 spike: a real move built on a temporary panic.
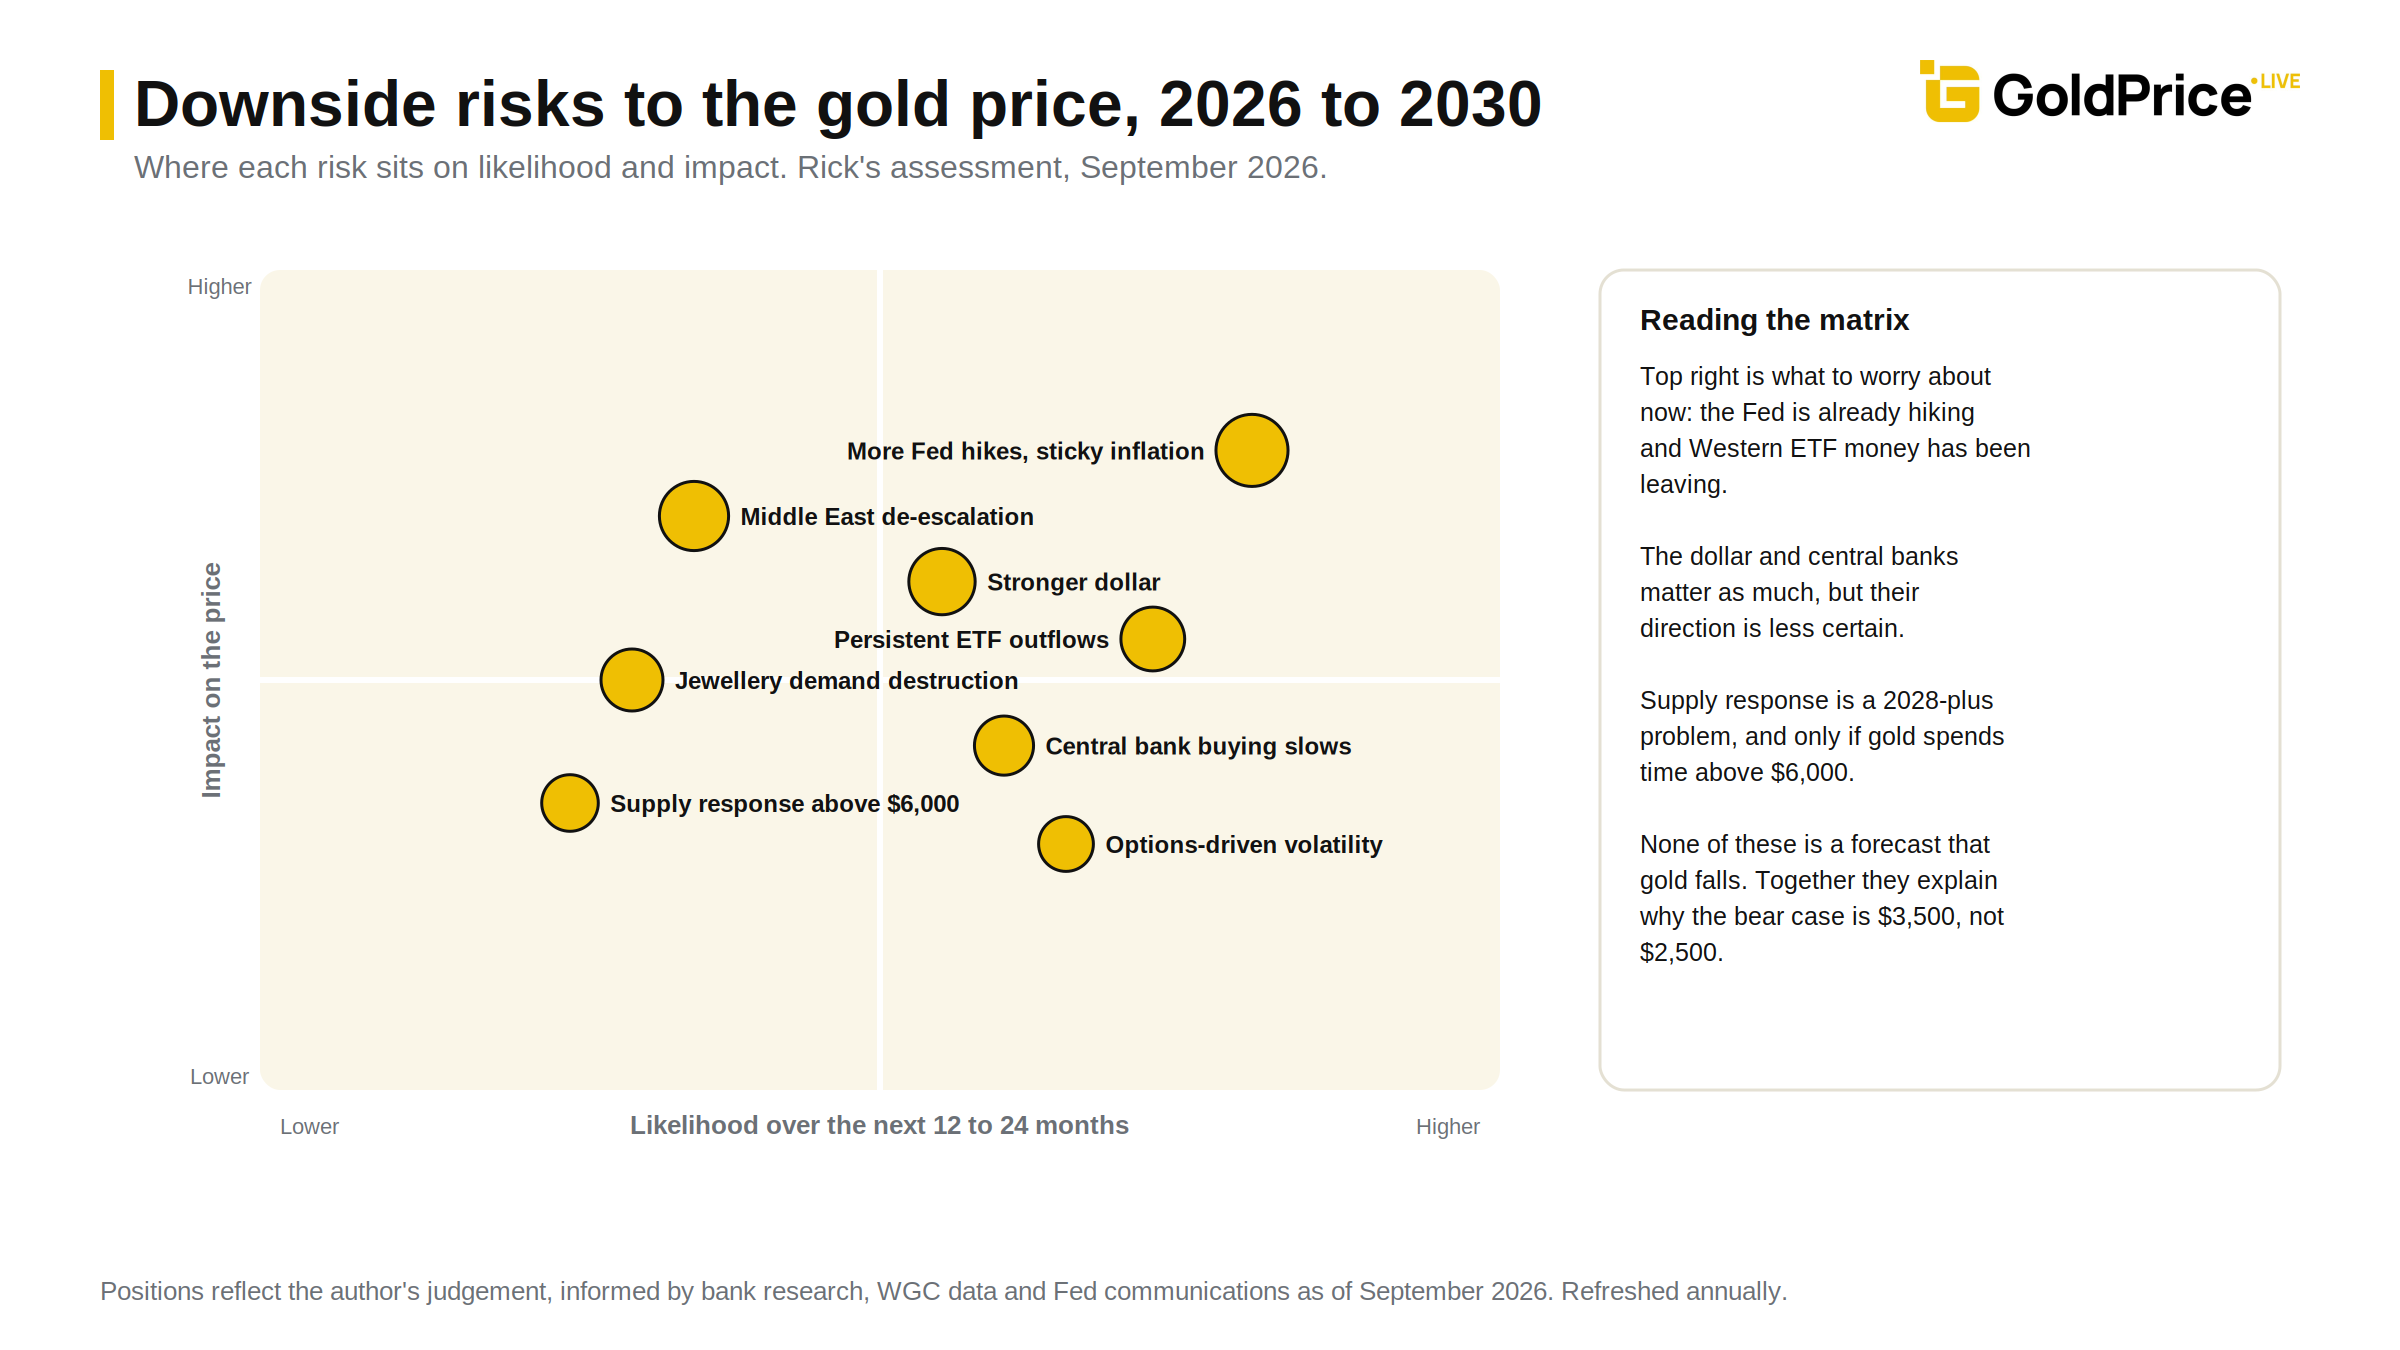
I'd be doing you a disservice if I only gave you the bull case.
Sticky inflation and more hikes. Markets are pricing hikes in October and December. Each one lifts the opportunity cost of holding gold.
Options-driven volatility. Goldman has flagged that dealer hedging of gold derivatives amplified both the January spike and the June fall. Realised volatility topped 50% in the first half of 2026. Gold is no longer a quiet asset.
Demand destruction. Jewellery demand fell to its lowest quarterly level since the pandemic in Q2 2026. High prices are choking off the market's largest traditional buyer.
Central bank fatigue. First-half 2026 official buying was the lowest since 2022, and the WGC expects the full year to finish below 2025. Central bank demand sets the floor, but the floor can move.
Supply response. JPMorgan notes that prices above $6,000 make lower-grade deposits economic. Higher prices eventually cure higher prices.
Geopolitical calm. A resolution in the Middle East removes the fear premium.
Forecast fatigue. Every major bank cut its 2026 target this year. When the consensus is already leaning one way, the surprises tend to come from the other.
 Run the numbers for yourself
The most useful thing you can do with any gold price prediction is test it against your own position. Our gold investment calculator lets you enter an amount, a purchase price and a target price or annual growth rate and see what each scenario above would mean for you in dollars. Try the 5%, 9% and 15% paths to 2030 and see which one you'd be comfortable holding through.
Founder of GoldPrice.Live and GoldBuzz.com. Passionate about gold and silver. Designed the 4-year Theseus research project. Ex-British Aerospace and Scotland Yard, now based in Canada.