


 By Rick Adams•September 30, 2026
I've been watching gold for a long time, and if there's one thing I'd tell a new investor before they buy a single ounce, it's this: study the gold price history first. The past doesn't repeat itself neatly, but gold's long record has a rhythm to it. Long climbs, long sulks and the odd violent spike. Once you've seen the whole 50-year picture, the daily noise stops rattling you.
That's the job of this article: gold's story from the end of the gold standard to the record highs of the mid-2020s, decade by decade, and what the 10, 20 and 50 year trends actually tell us. Everything here is built from our own gold price historical data, which runs daily from 1970 to the present, so the charts are ours and the numbers are checkable.
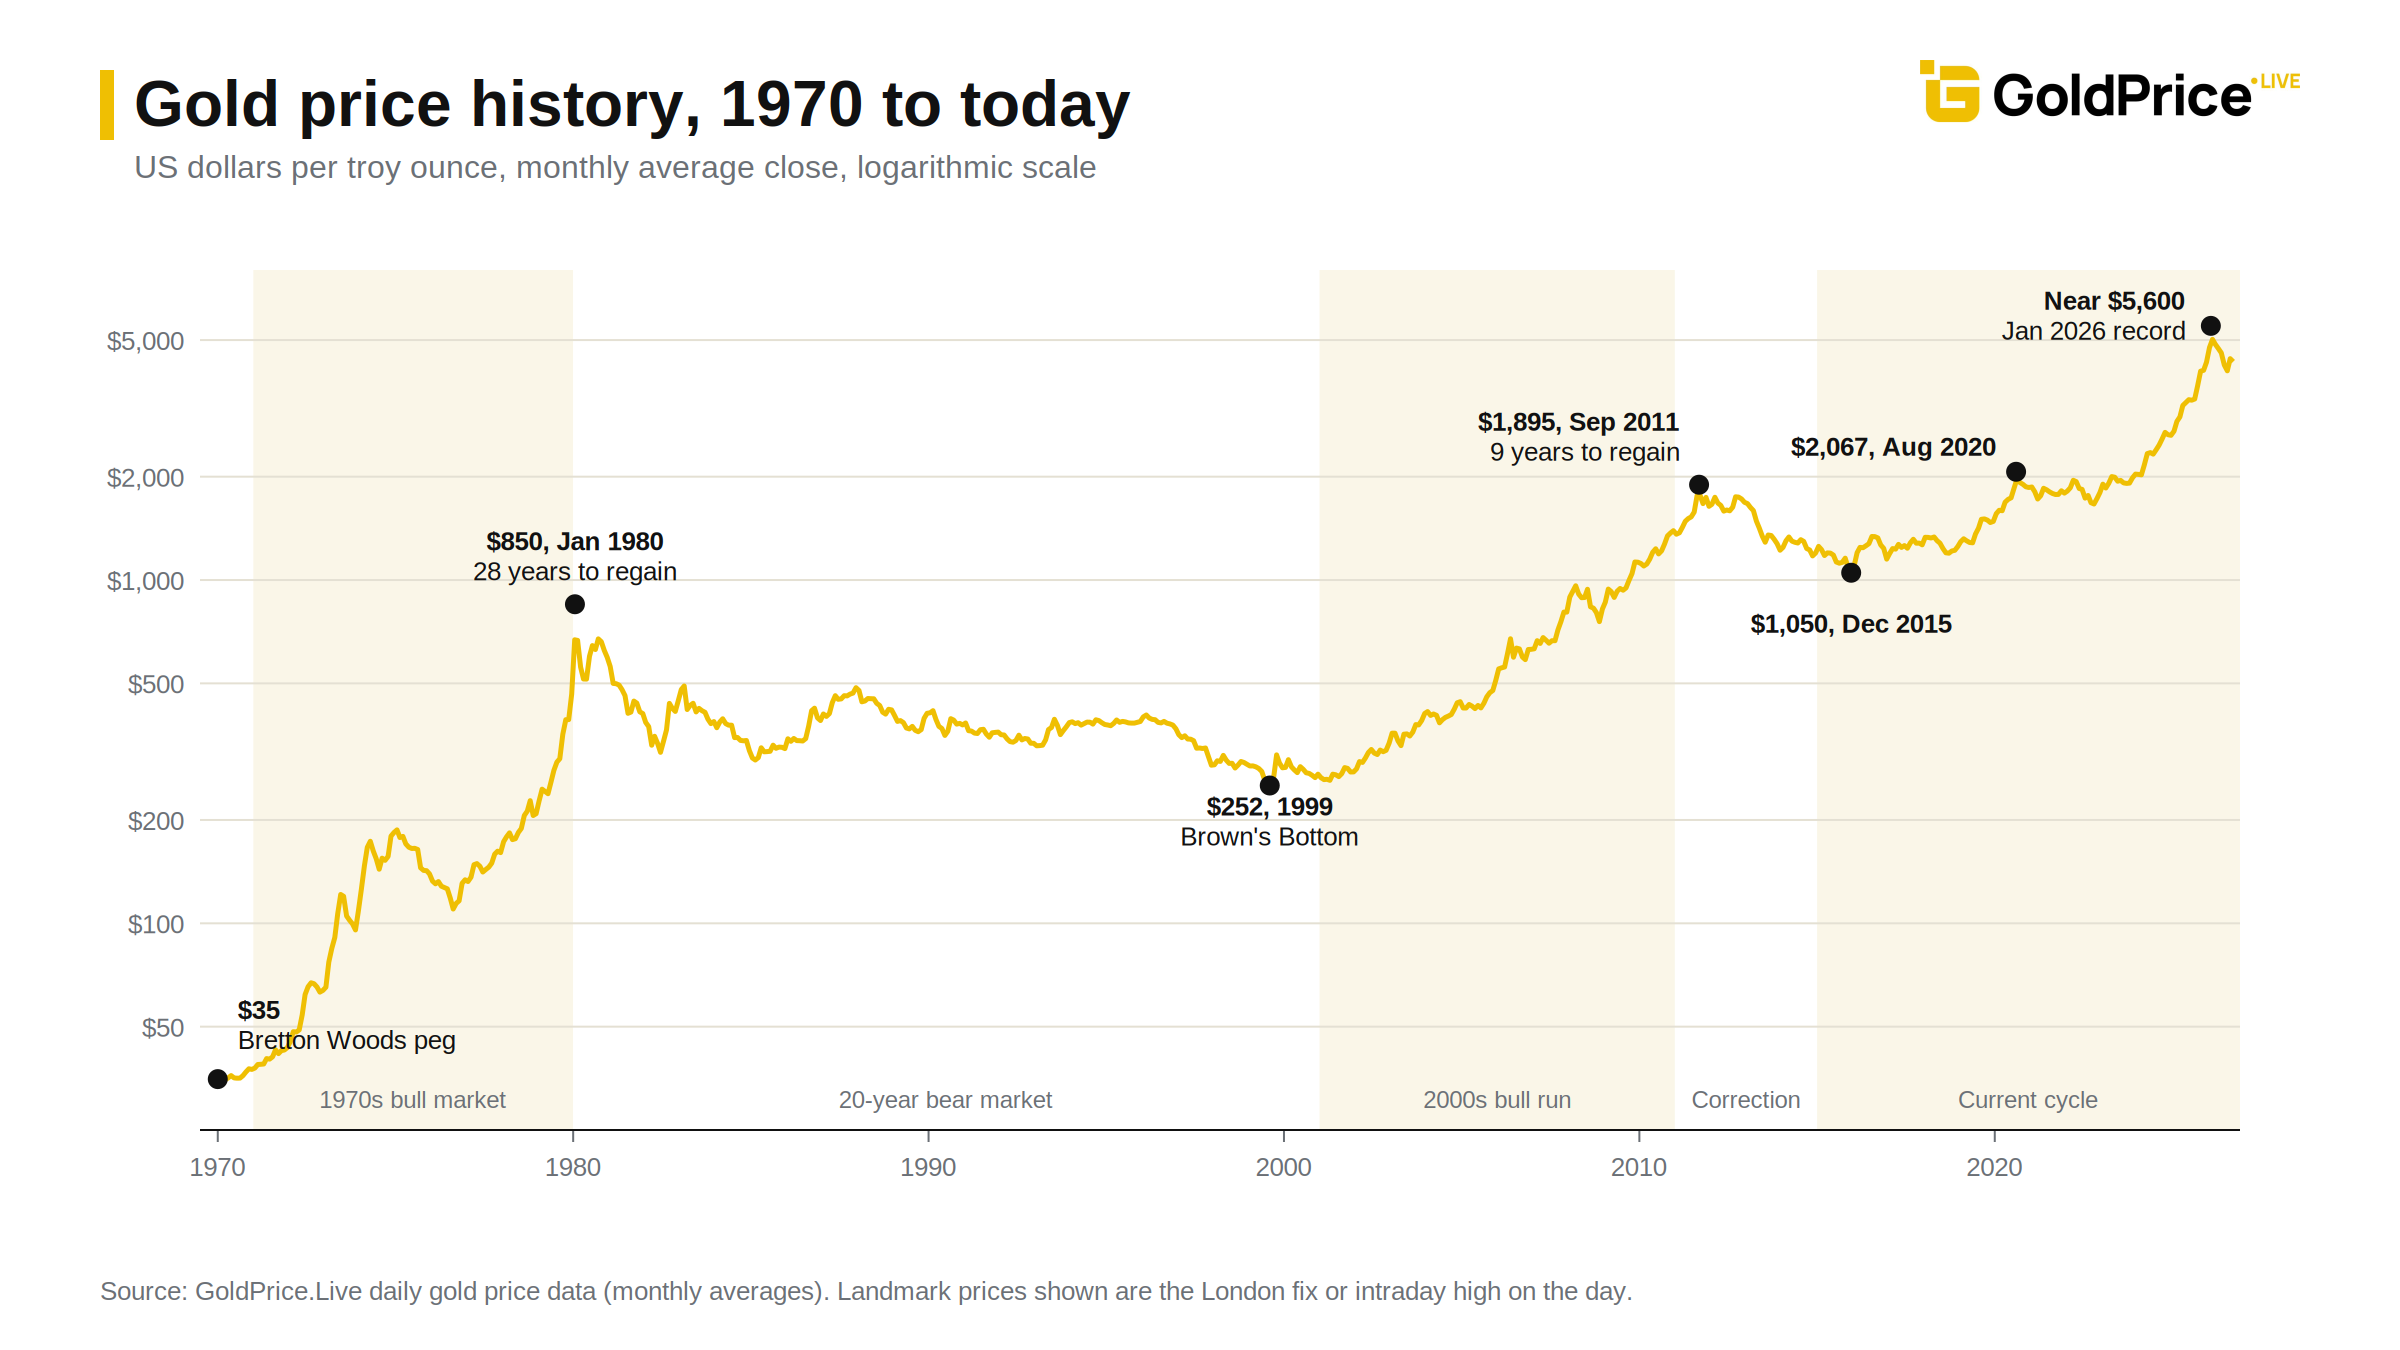
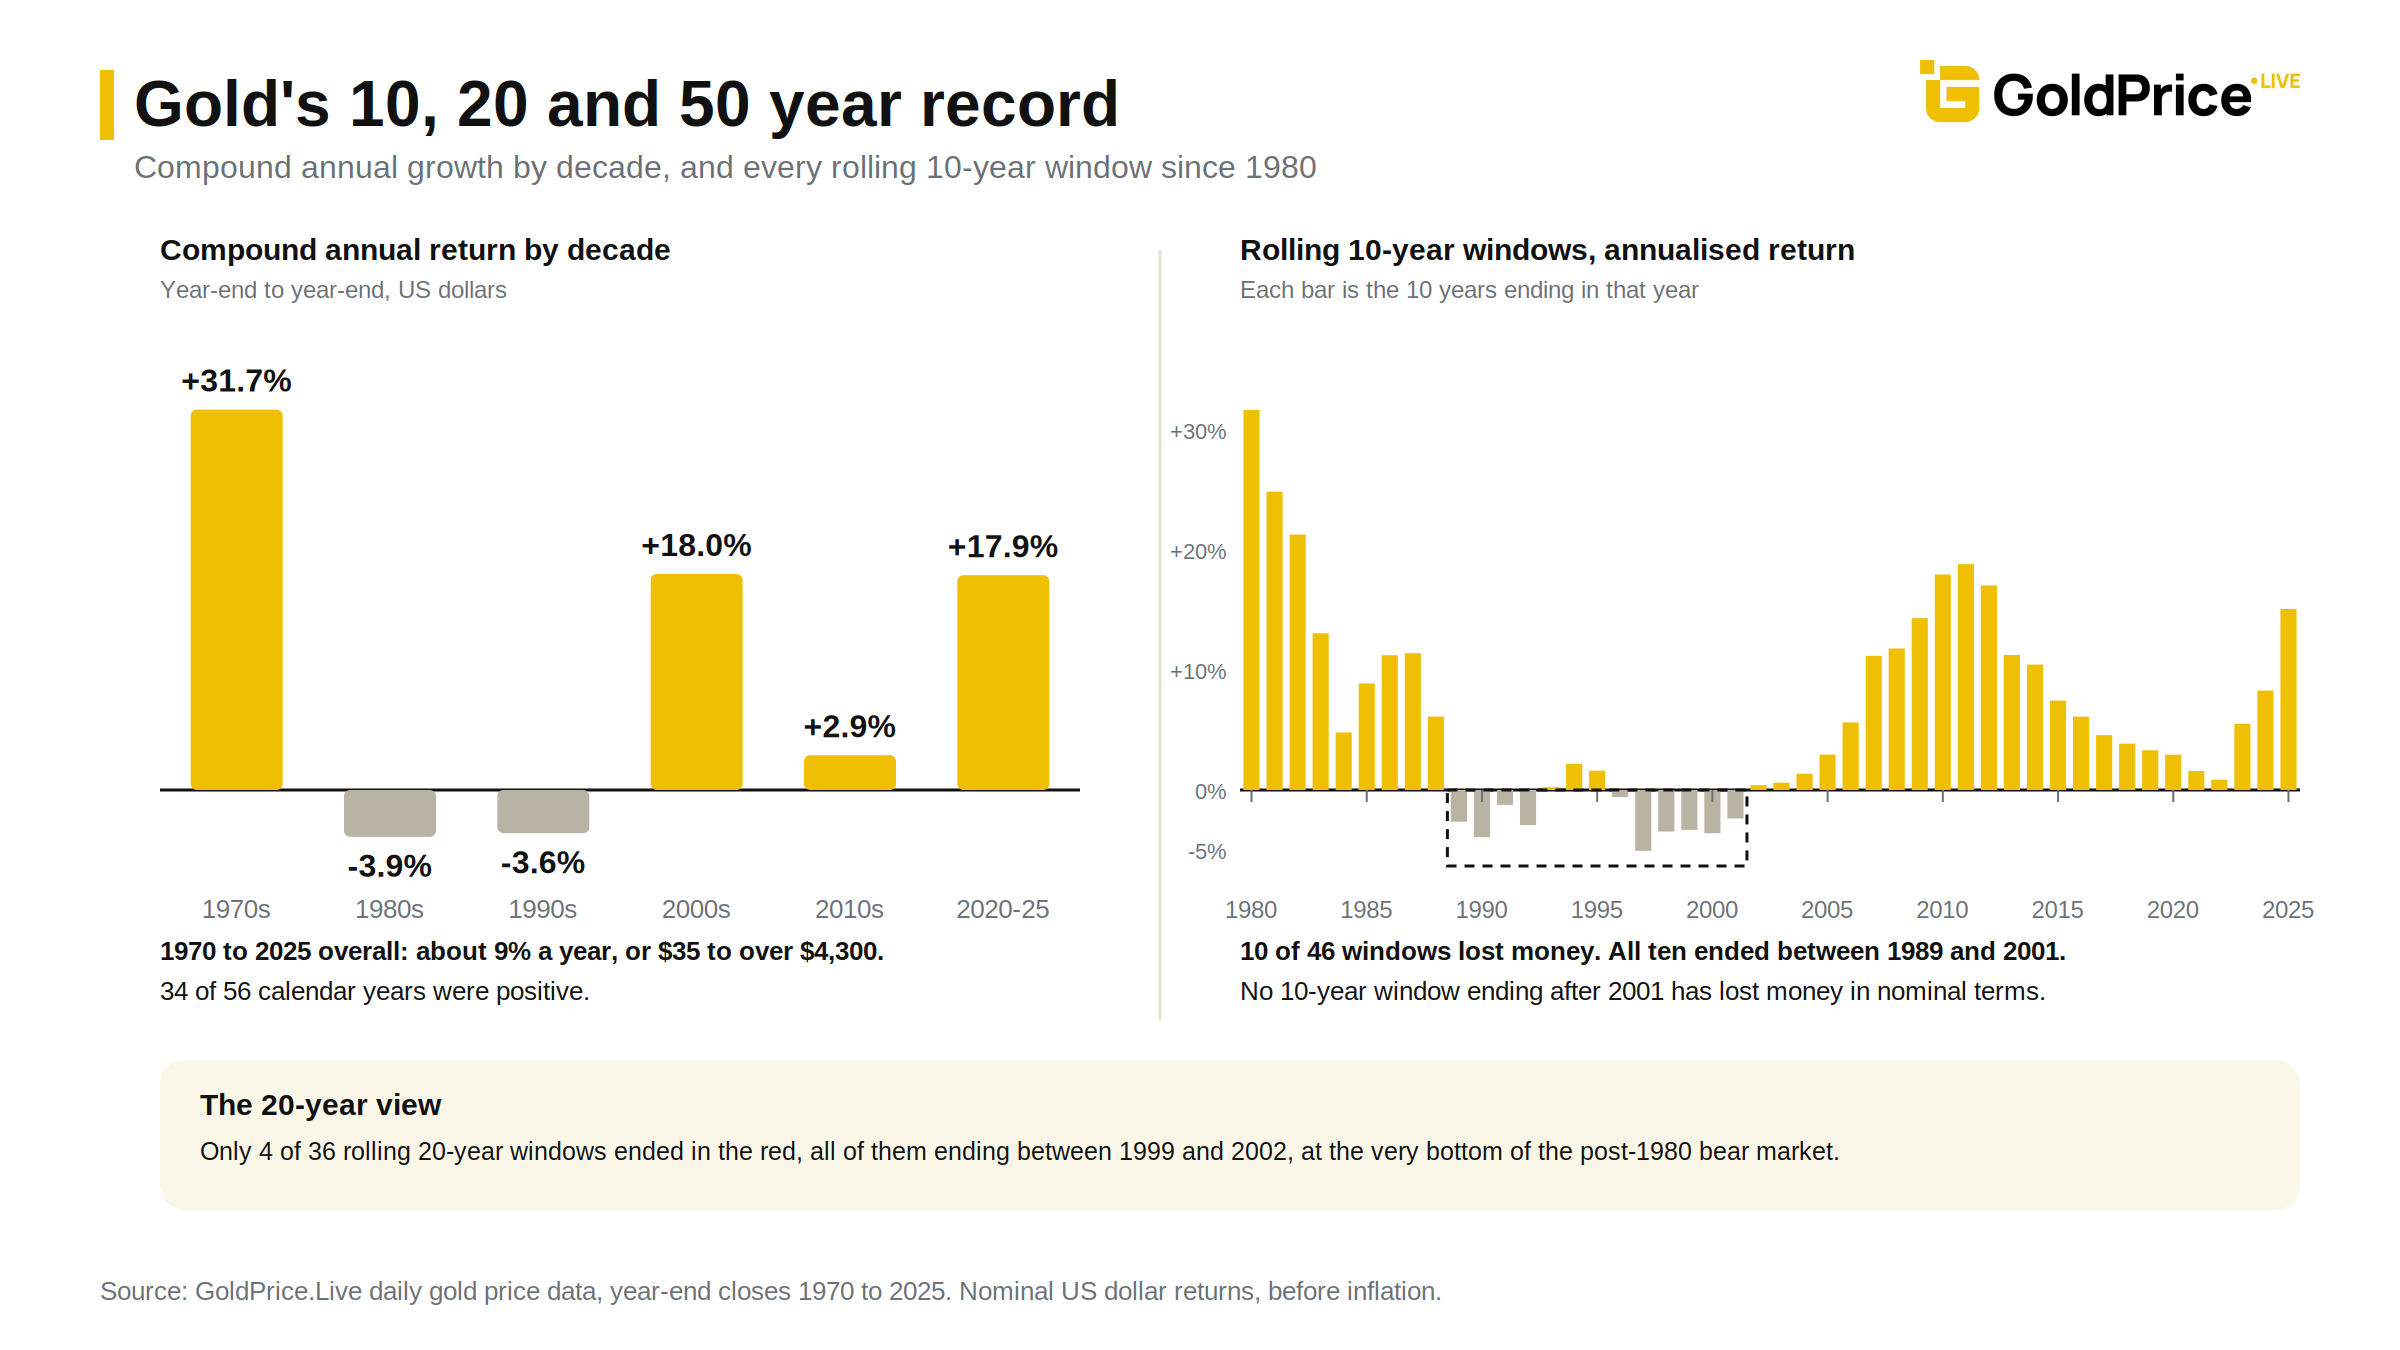
Here's a number worth remembering. From the start of 1970 to the end of 2025, gold compounded at roughly 9% a year in US dollar terms, taking an ounce from about $35 to over $4,300. Stocks did better with dividends reinvested, but for an asset that pays nothing and just sits in a vault, that's a remarkable run.
The catch is that the 9% wasn't delivered smoothly. Our data shows 34 positive calendar years out of 56, which means gold lost money in nearly four years out of ten. Some of the bad stretches lasted the best part of two decades. Buy at the 1980 peak and you waited until 2008 to see your money back in nominal terms, and considerably longer once inflation is counted.
So gold's history matters for two reasons. It shows what gold does when the financial system wobbles, which is why most people hold it. And it shows what gold does when the system is humming along nicely, which is often nothing at all for years on end.
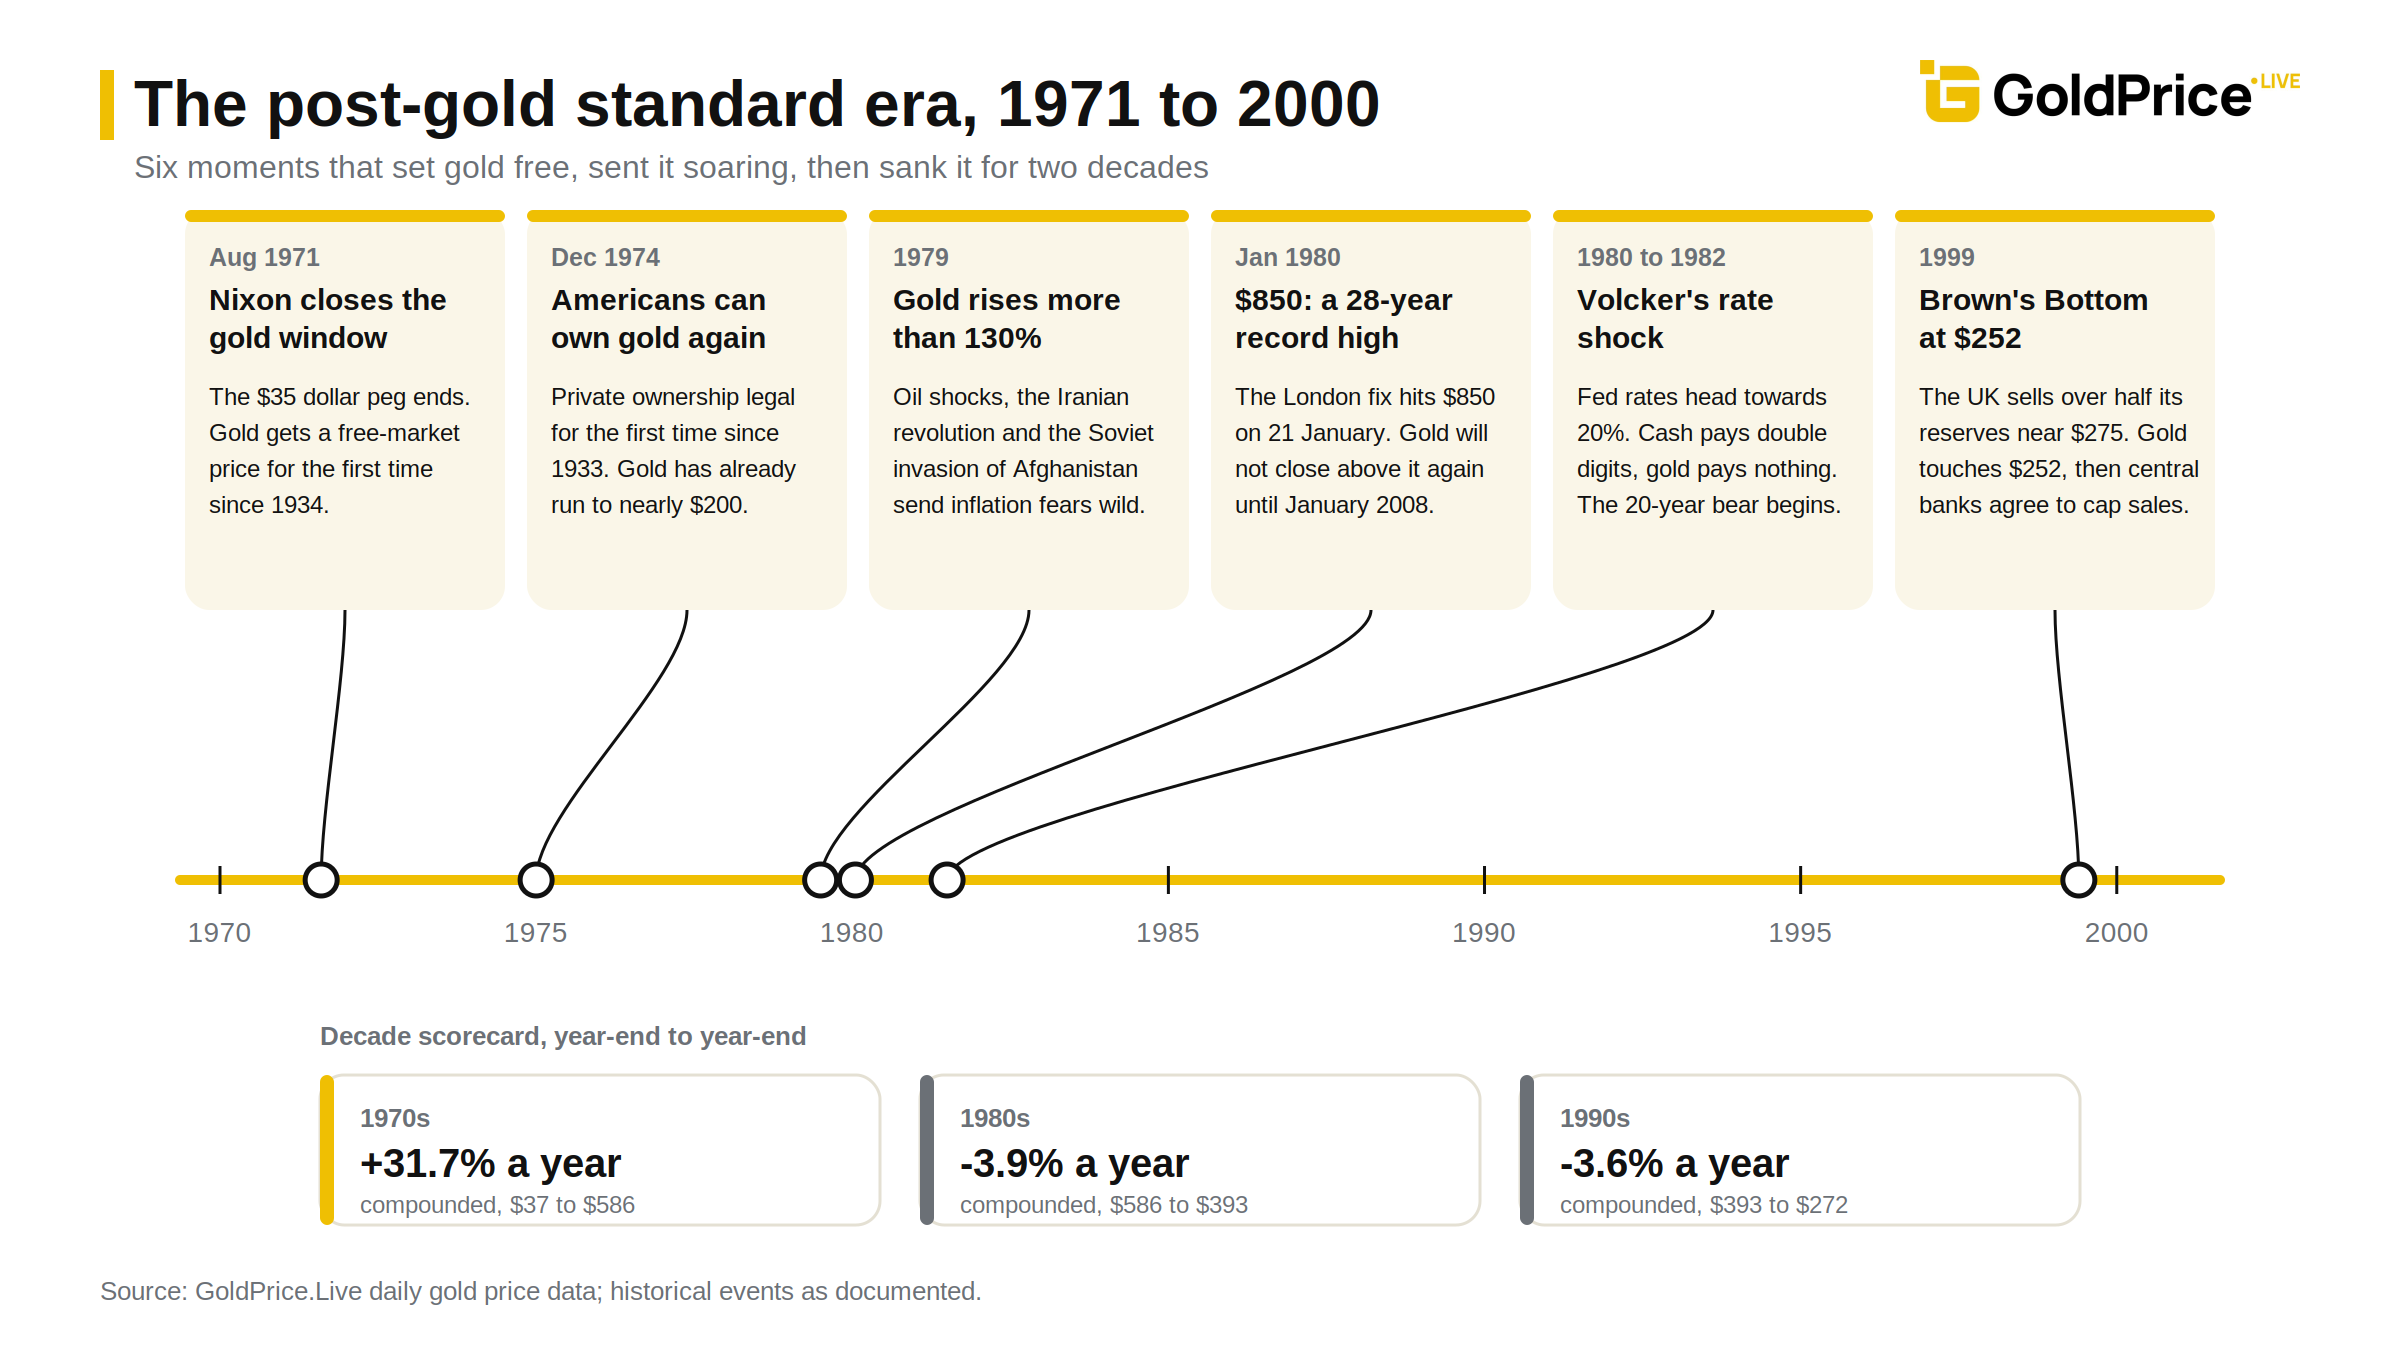
For most of the 20th century, gold didn't really have a price in the sense we'd use today. Under the Bretton Woods system of 1944, the dollar was pegged to gold at $35 an ounce and everything else was pegged to the dollar. Gold's price was a policy decision.
That ended on 15 August 1971, when President Nixon closed the "gold window" and stopped converting dollars into gold for foreign governments. Two devaluations followed, taking the official price to $38 and then $42.22, but the official price soon stopped mattering. American citizens were allowed to own gold bullion again from the end of 1974, for the first time since 1933, and by then gold had already run from $35 to nearly $200.
The 1970s was the first great gold bull market of the modern era, and it was driven by inflation. Oil shocks and loose money sent US consumer prices into double digits and the dollar into decline. After a nasty 1975-76 correction that took gold back to around $105, it rose more than 130% in 1979 alone, powered by the Iranian revolution, the Soviet invasion of Afghanistan and a general feeling that the US had lost control of its currency. On 21 January 1980 the London afternoon fix reached $850, a level that stood as the nominal record for 28 years.
Then came the long sulk. Paul Volcker's Federal Reserve pushed interest rates towards 20% to kill inflation, and it worked. Once investors could earn double-digit yields on cash with inflation falling, the case for a metal that paid nothing collapsed. Our data shows the price ended the 1980s about a third below where it started, and did roughly the same again in the 1990s.
The low point, in more ways than one, came in 1999. Central banks had become net sellers, and in May of that year the UK Treasury announced it would sell more than half of Britain's gold reserves. Gold slumped to around $252 an ounce that summer. The UK's sales, completed between 1999 and 2002 at an average price of roughly $275, are still known in the trade as "Brown's Bottom" after the Chancellor who ordered them. Ironically, the same year saw European central banks sign the first Central Bank Gold Agreement, capping their sales and quietly removing the biggest overhang from the market.
 The 2000s bull run: $300 to $1,900
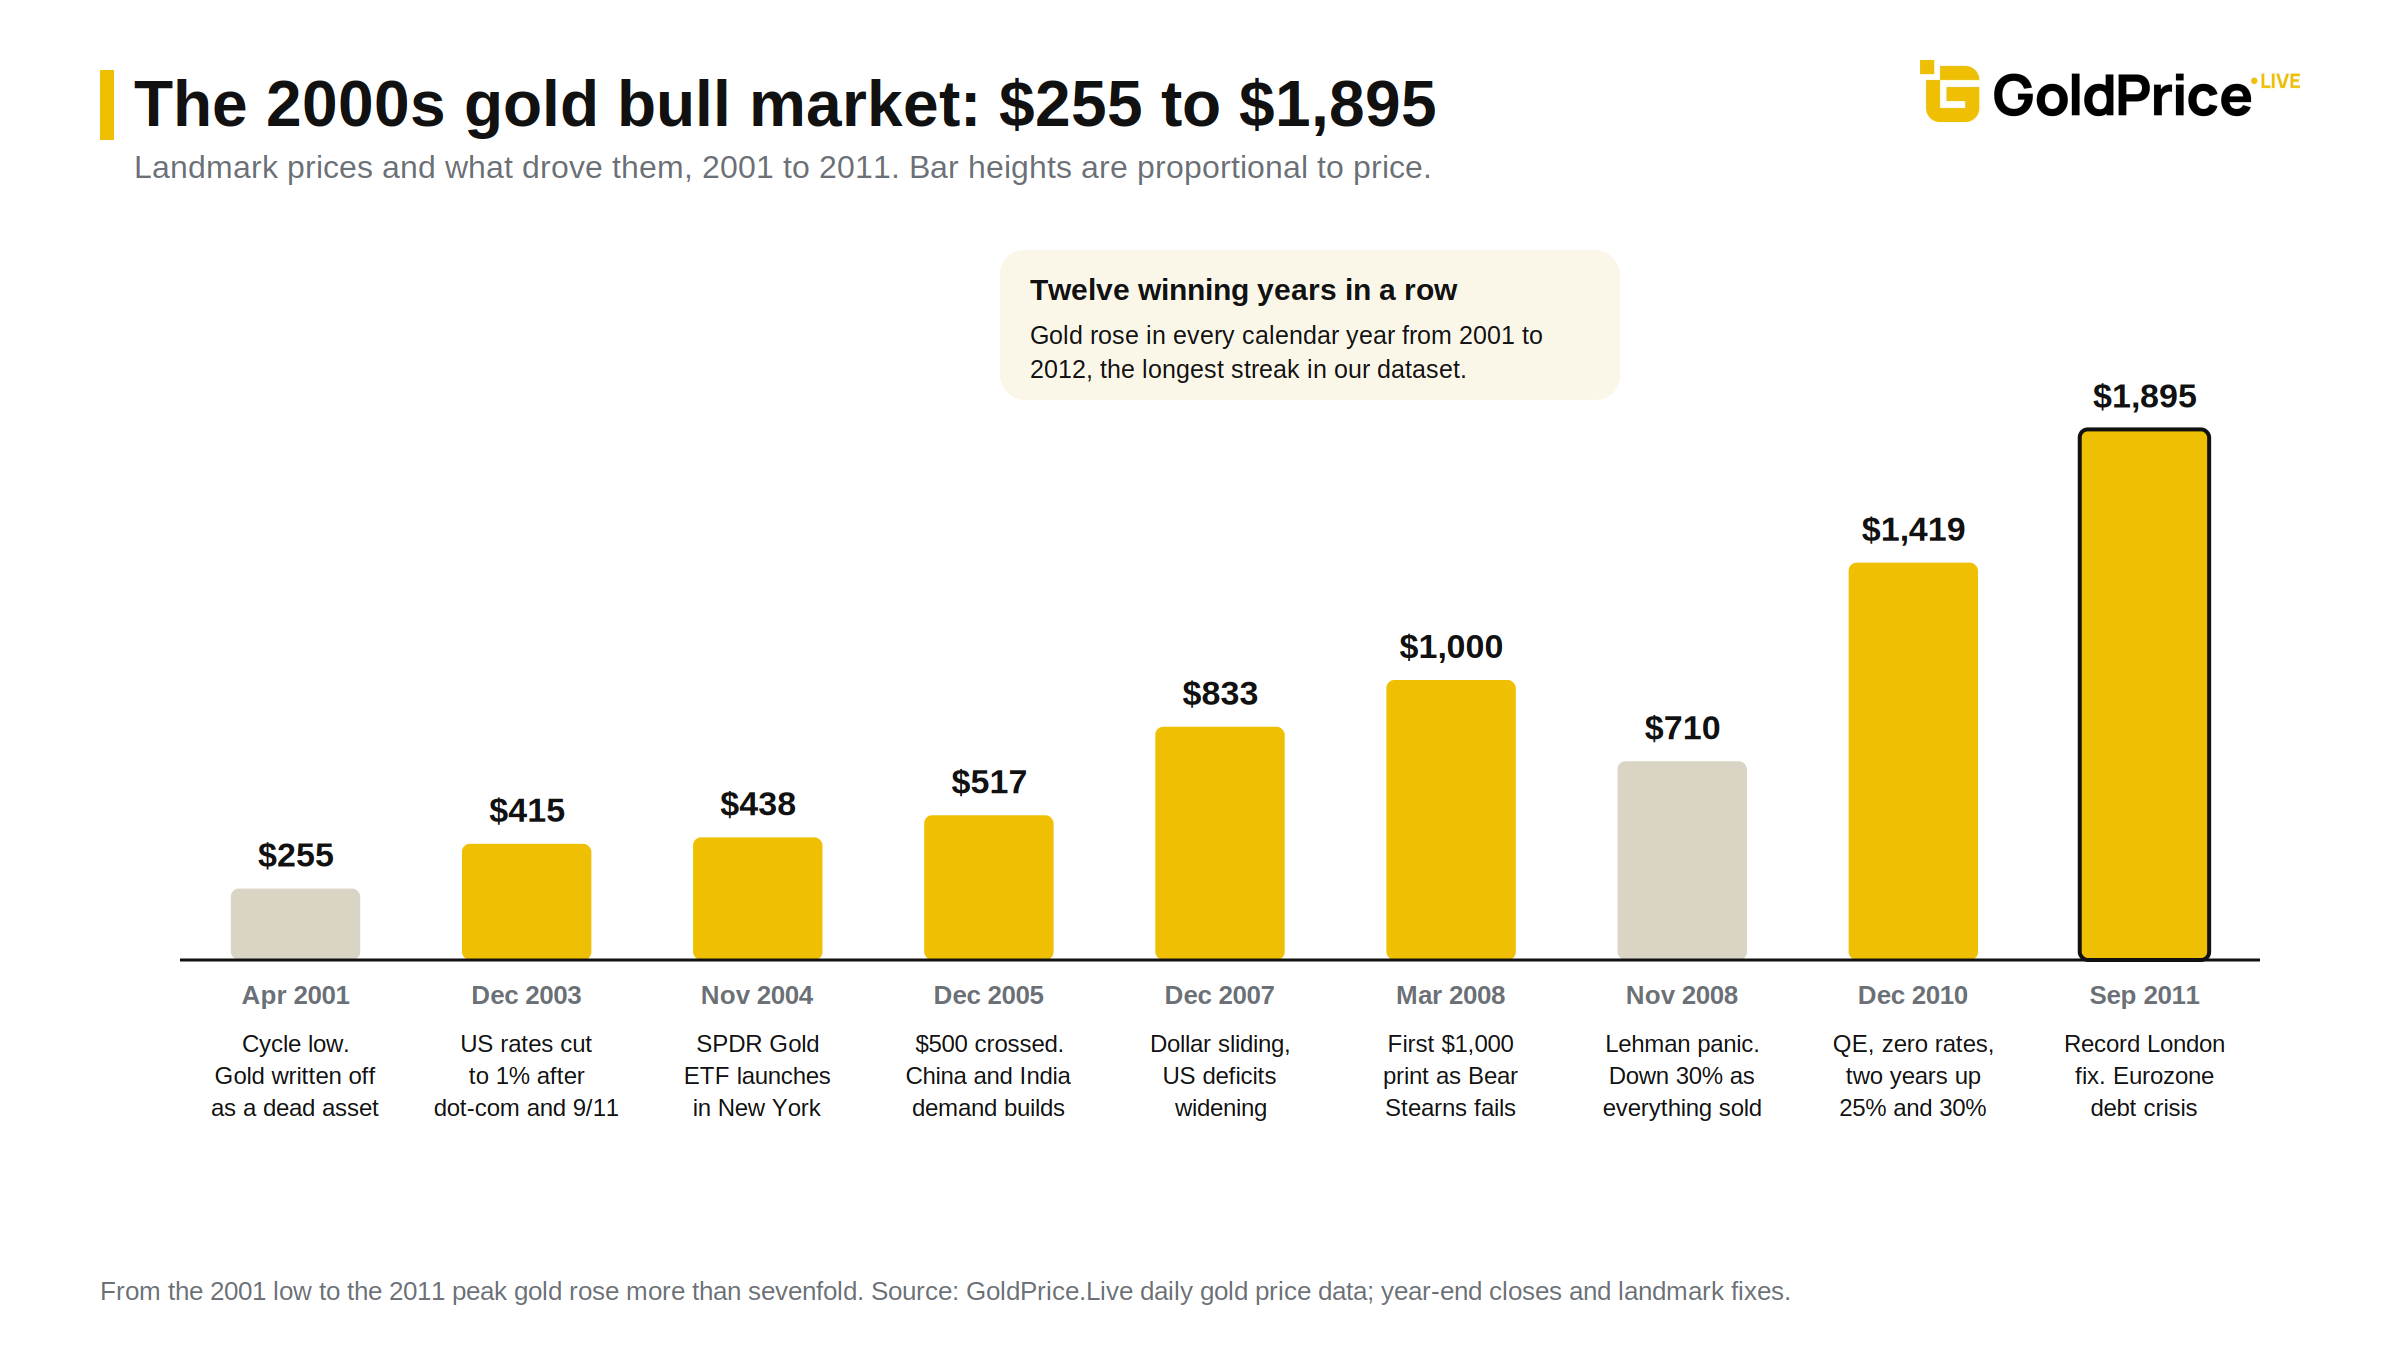
Nobody rang a bell at the bottom. Gold spent 2000 and 2001 drifting between $260 and $290, widely written off as a dead asset. What changed was the backdrop. The dot-com crash and the 9/11 attacks brought US rates down to 1% by 2003, the dollar began a multi-year decline, and America started running large deficits to fund wars and tax cuts.
The other change was structural. In November 2004 the SPDR Gold Shares ETF launched in New York, letting ordinary investors and pension funds buy gold exposure with a click. Physical demand from a rapidly enriching China and India added a steady bid underneath. Gold crossed $500 in late 2005, $700 in 2006 and $800 in late 2007.
Then 2008 arrived. Gold breached $1,000 for the first time in March 2008, right as Bear Stearns collapsed. But when Lehman Brothers failed that September and everything was sold to raise cash, gold fell too, dropping around 30% from its March peak to a low near $710 in November. The 2008 financial crisis gold experience taught a lesson that would be repeated in 2020: in a proper liquidity panic, gold gets sold with everything else. It's what happens afterwards that counts.
And afterwards, gold flew. The Fed's response was quantitative easing and a balance sheet that swelled by trillions. Investors who had never thought about currency debasement suddenly did. Gold finished 2008 up on the year, one of very few assets that could say so, then rose 25% in 2009 and nearly 30% in 2010. The eurozone debt crisis added another layer of fear. On 5 September 2011 the London fix set a new record at $1,895, with intraday trading nudging $1,920 the next day.
From the 2001 low to the 2011 peak, gold rose more than sevenfold. Our records show twelve consecutive positive calendar years from 2001 to 2012, the longest winning streak in the dataset. If you're wondering about the gold price 10 years ago from any point in that decade, the answer was almost always "a lot lower".
 The 2011 to 2015 correction
Every bull market ends with more people convinced it can't. By late 2011 the case for gold seemed watertight. Rates were zero and Europe was on fire. And yet the price stalled, chopped sideways through 2012, and then broke.
The moment most people remember is April 2013. Over two trading days, 12 and 15 April, gold fell by around $200, its biggest two-day drop in three decades. Rumours that Cyprus would sell its reserves lit the fuse, but the underlying cause was simpler: the crisis fear that had driven gold up was fading, US stocks were roaring, and the Fed had started talking about "tapering" its bond purchases. Gold ended 2013 down 28%, its worst year since 1981.
The bleed continued for two more years. The dollar strengthened sharply in 2014-15 as the Fed edged towards its first rate rise since 2006, and the ETF holdings that had swollen in the boom drained out just as steadily. Gold bottomed at around $1,050 in December 2015, the day after the Fed finally raised rates. Peak to trough, the correction took about 45% off the price.
The drawdown was brutal but brief compared with the 1980s, and physical buyers never went away. Chinese and Indian households and emerging-market central banks kept absorbing metal at the lower prices, which is a big reason the fall stopped where it did. Gold built a base between $1,150 and $1,350 from 2016 to 2018, and once the Fed reversed course and cut rates in 2019, it was climbing again.
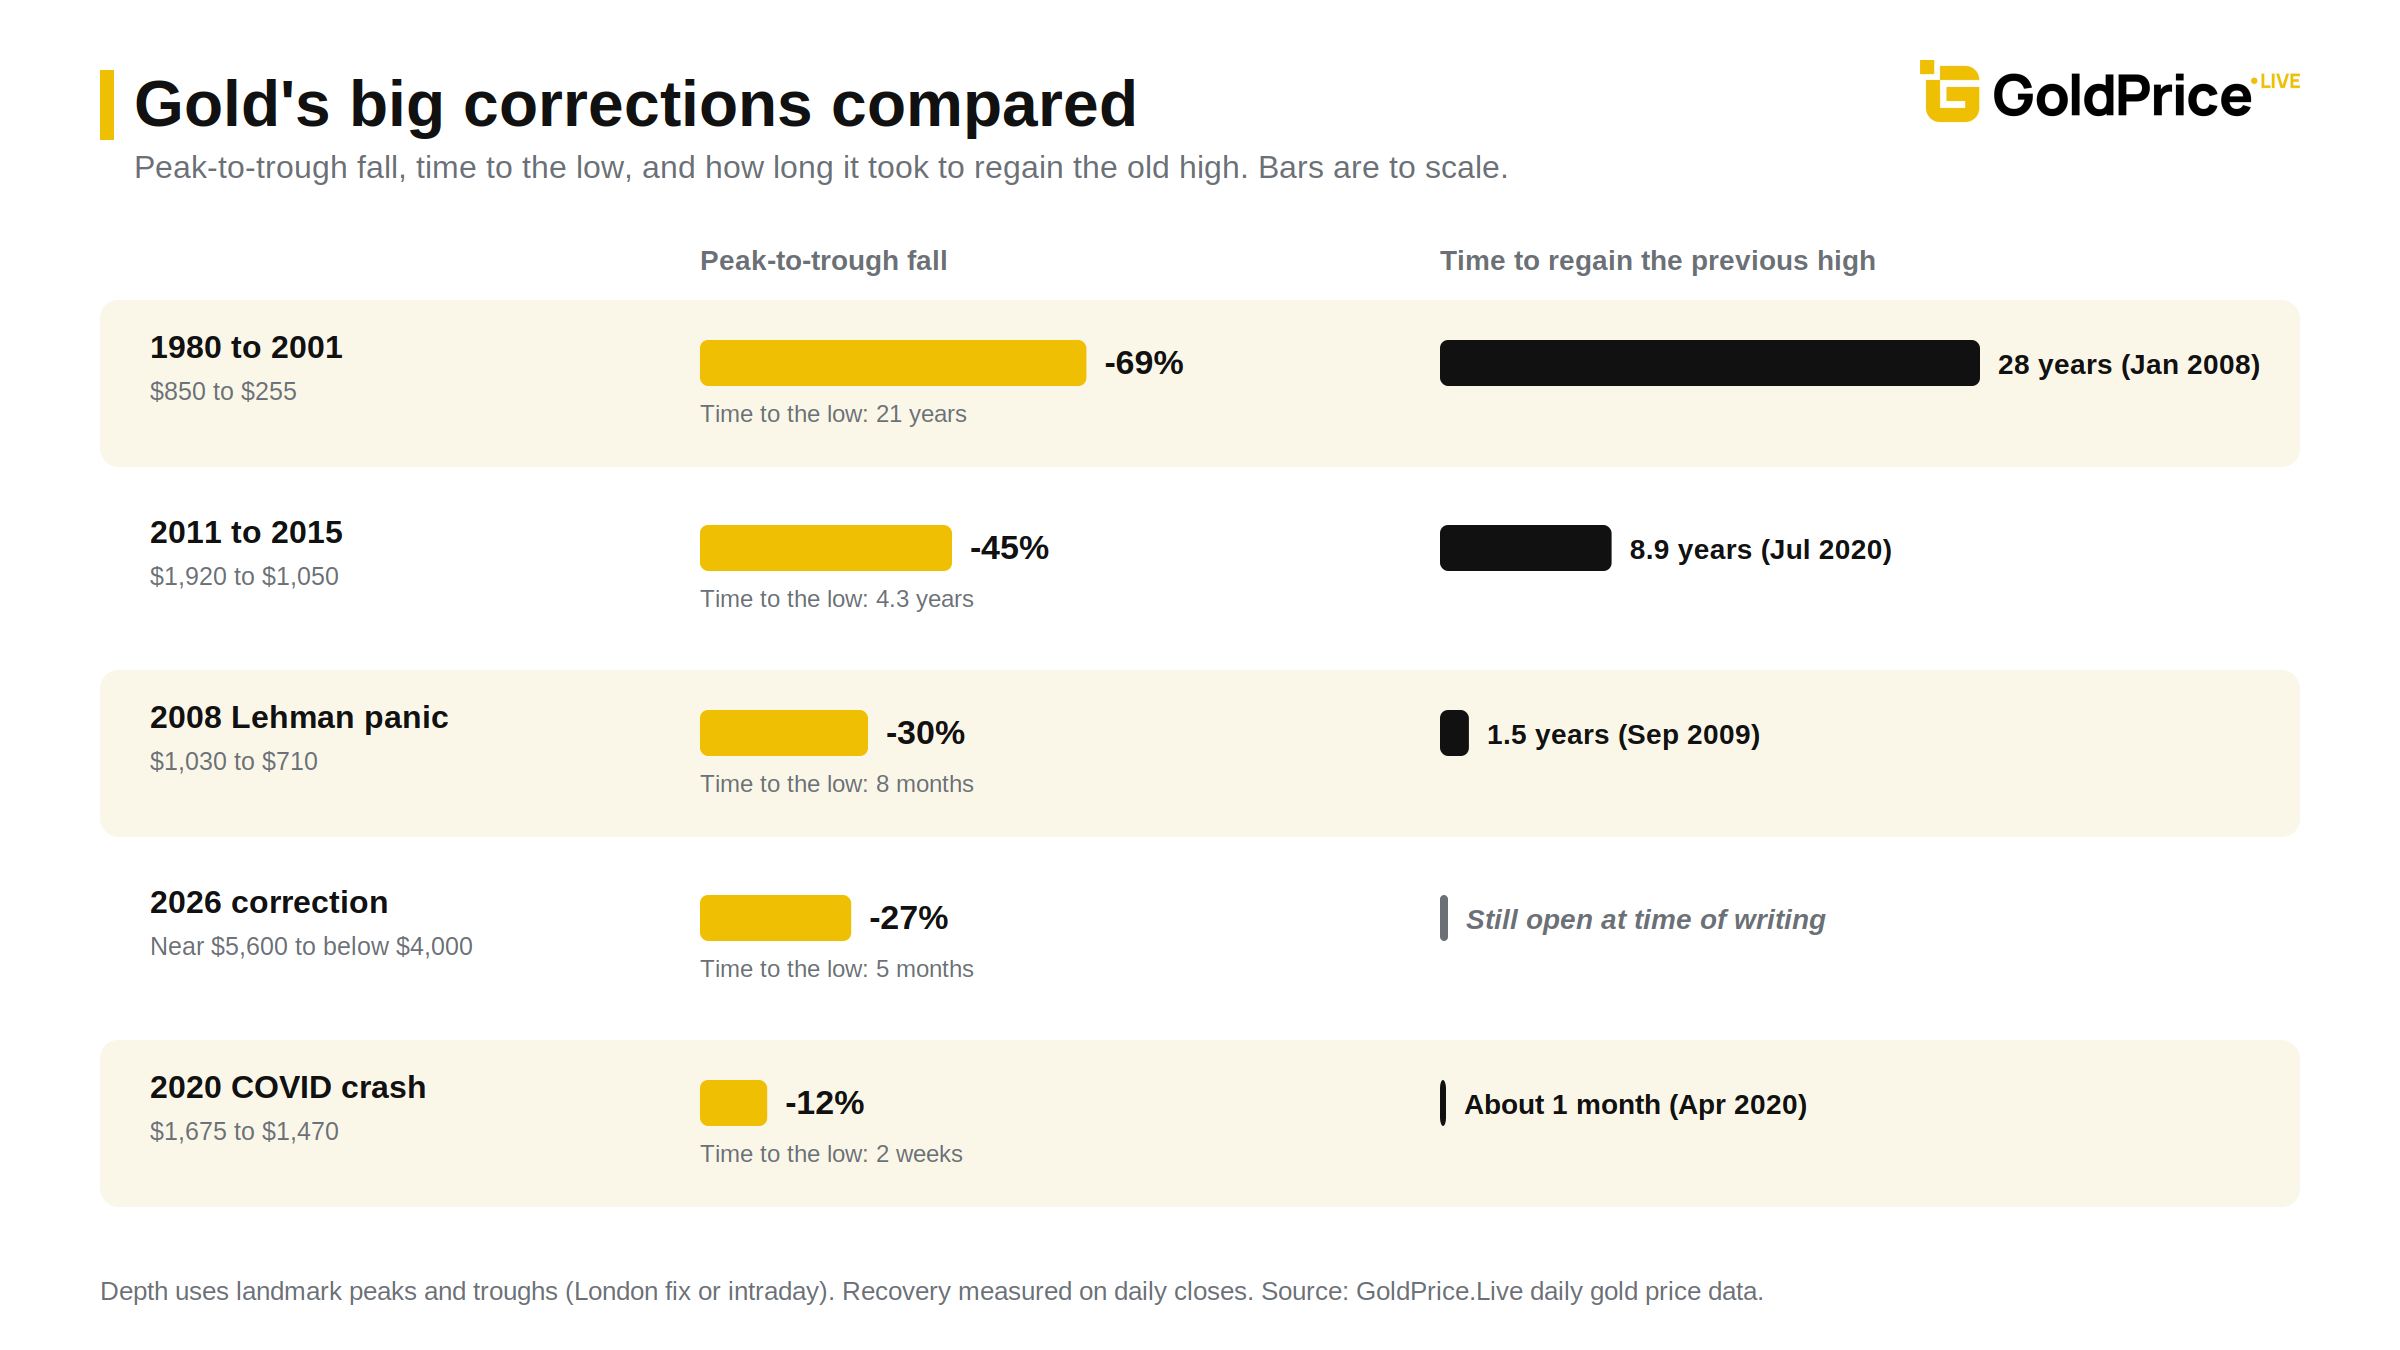
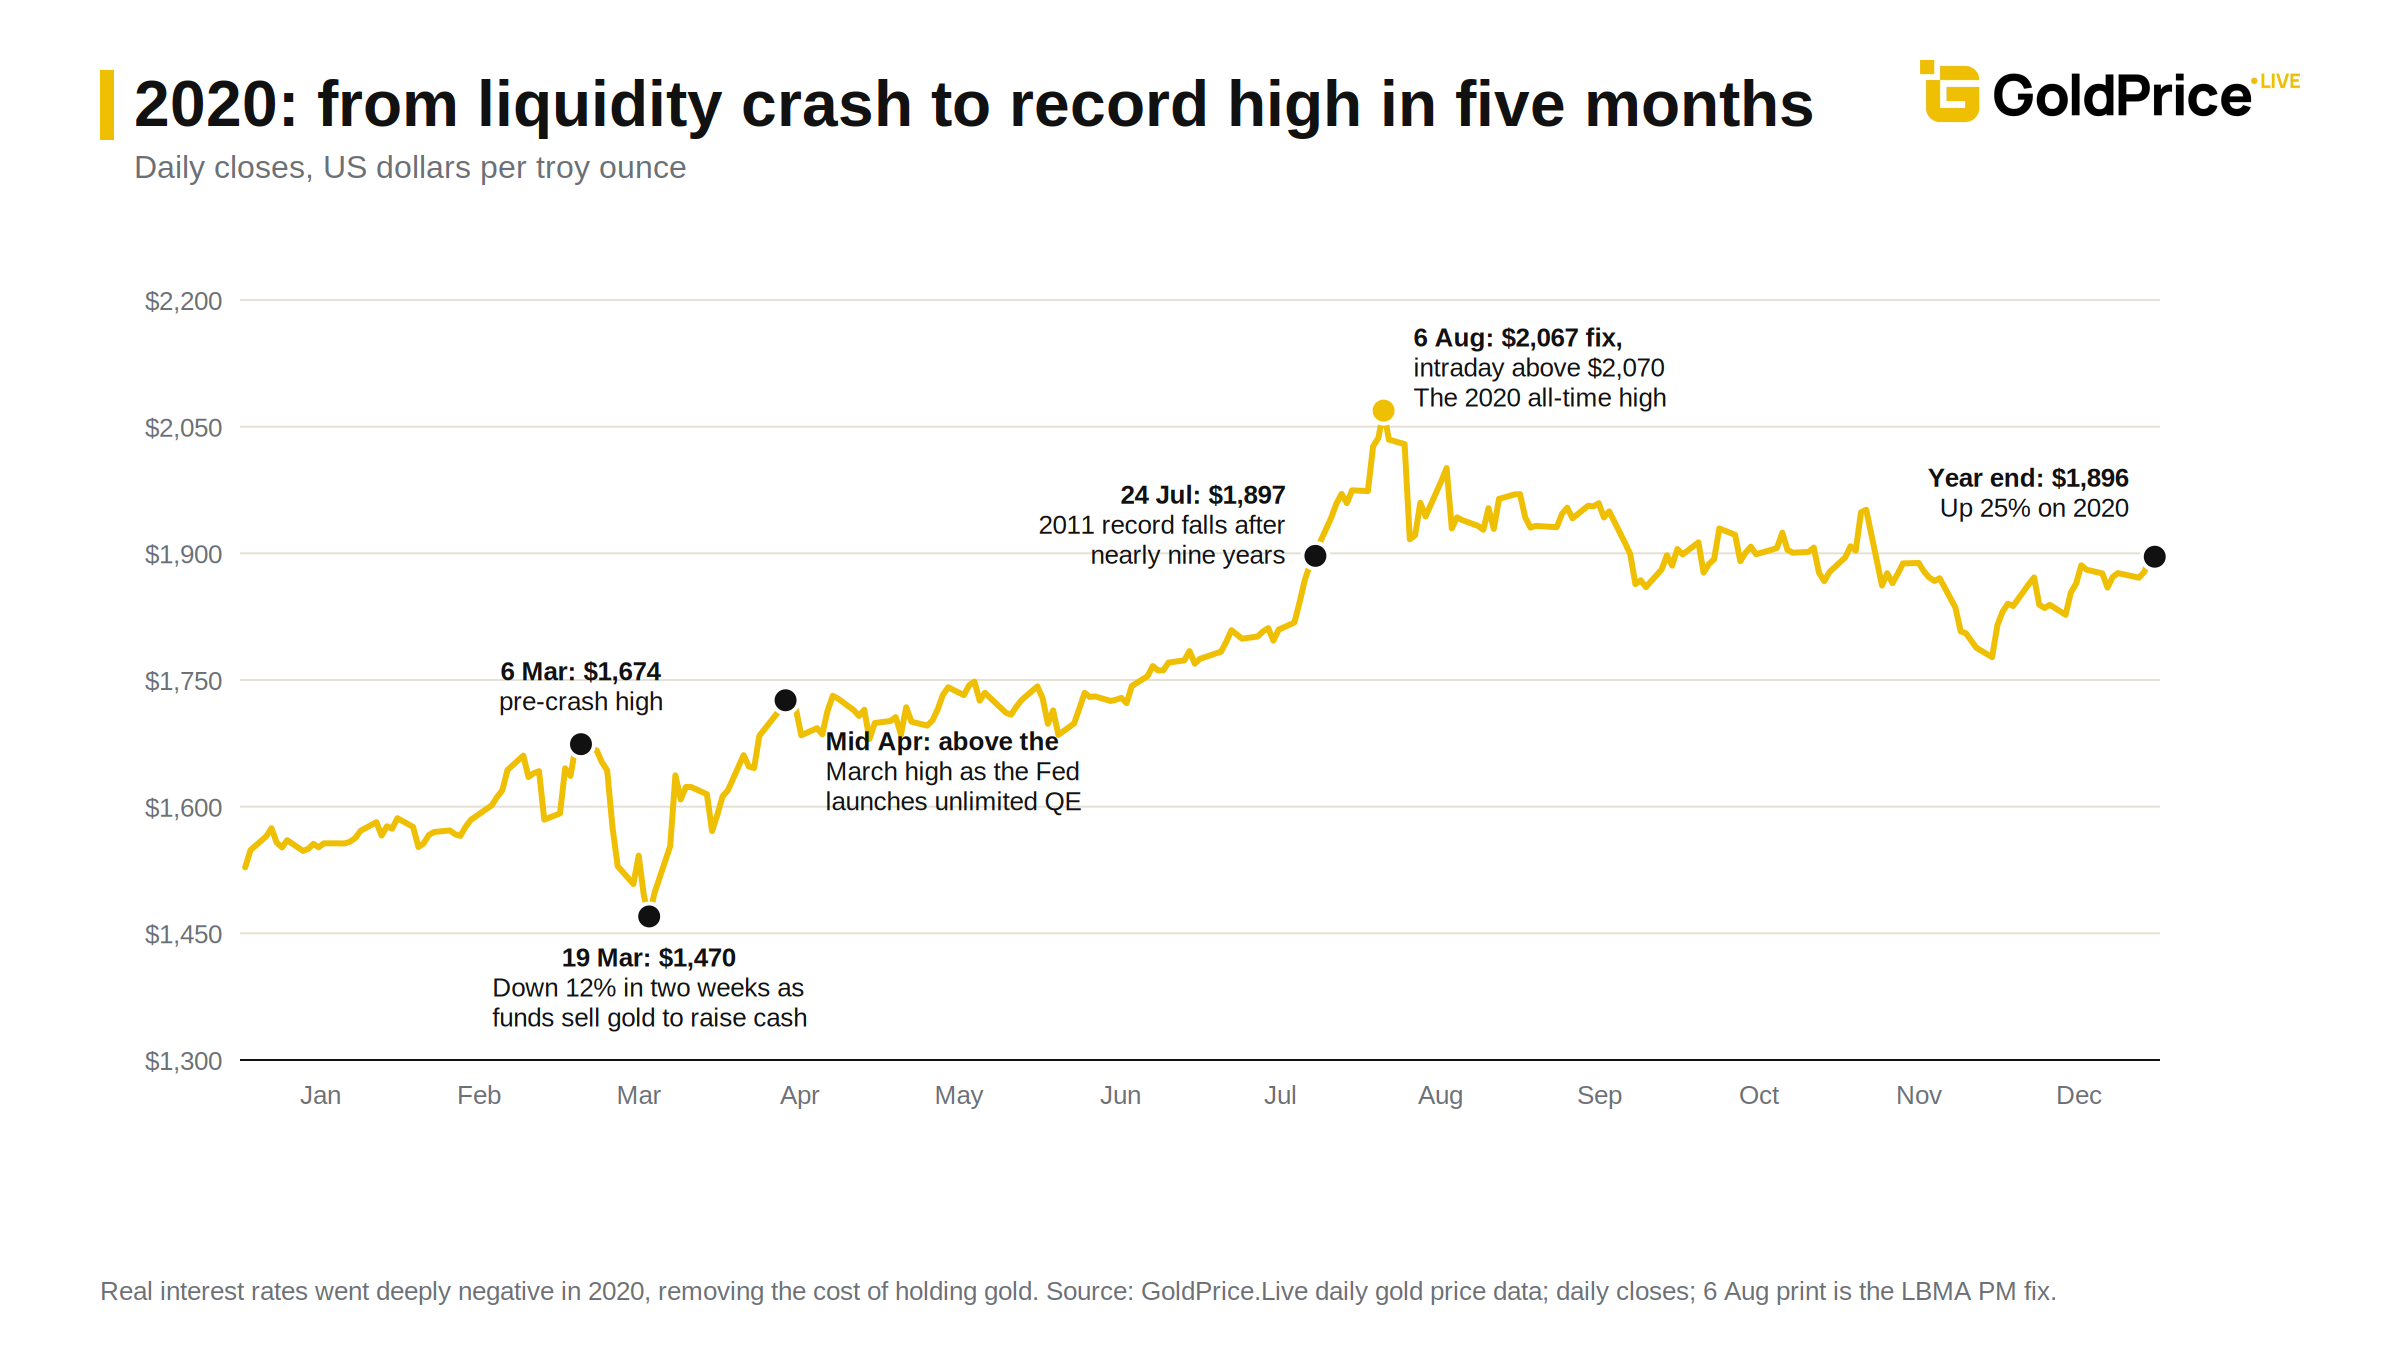
If you want a textbook case of how gold behaves in a crisis, 2020 is it. When the pandemic hit in March, markets went into the same liquidity spiral as 2008. Gold dropped about 12% in a fortnight as funds sold anything liquid to meet margin calls. Plenty of people concluded, again, that the safe haven had failed.
What followed was the fastest monetary and fiscal response in history. The Fed cut rates to zero and restarted QE on a scale that dwarfed 2008, while governments borrowed to pay wages directly. Real interest rates, the single most important long-run driver of the gold price, went deeply negative, and the opportunity cost of holding gold disappeared.
Gold went vertical. The 2011 record, which had stood for nearly nine years, fell in July 2020. The gold ATH 2020 arrived on 6 August, when the London afternoon fix printed above $2,067 and intraday trading briefly topped $2,070. The move from the March low to the August peak took less than five months and added roughly 40%.
After that it did what gold does after a spike. Once vaccines arrived and bond yields crept up, the price faded about 4% through 2021. Worth remembering when the next one comes: the peak of a gold run rarely coincides with the peak of the fear that caused it. Gold topped in August 2020 while the pandemic was far from over.
This is the section that will need to be refreshed as we move forward, because it covers the current cycle. The mechanisms don't change; the readings do.
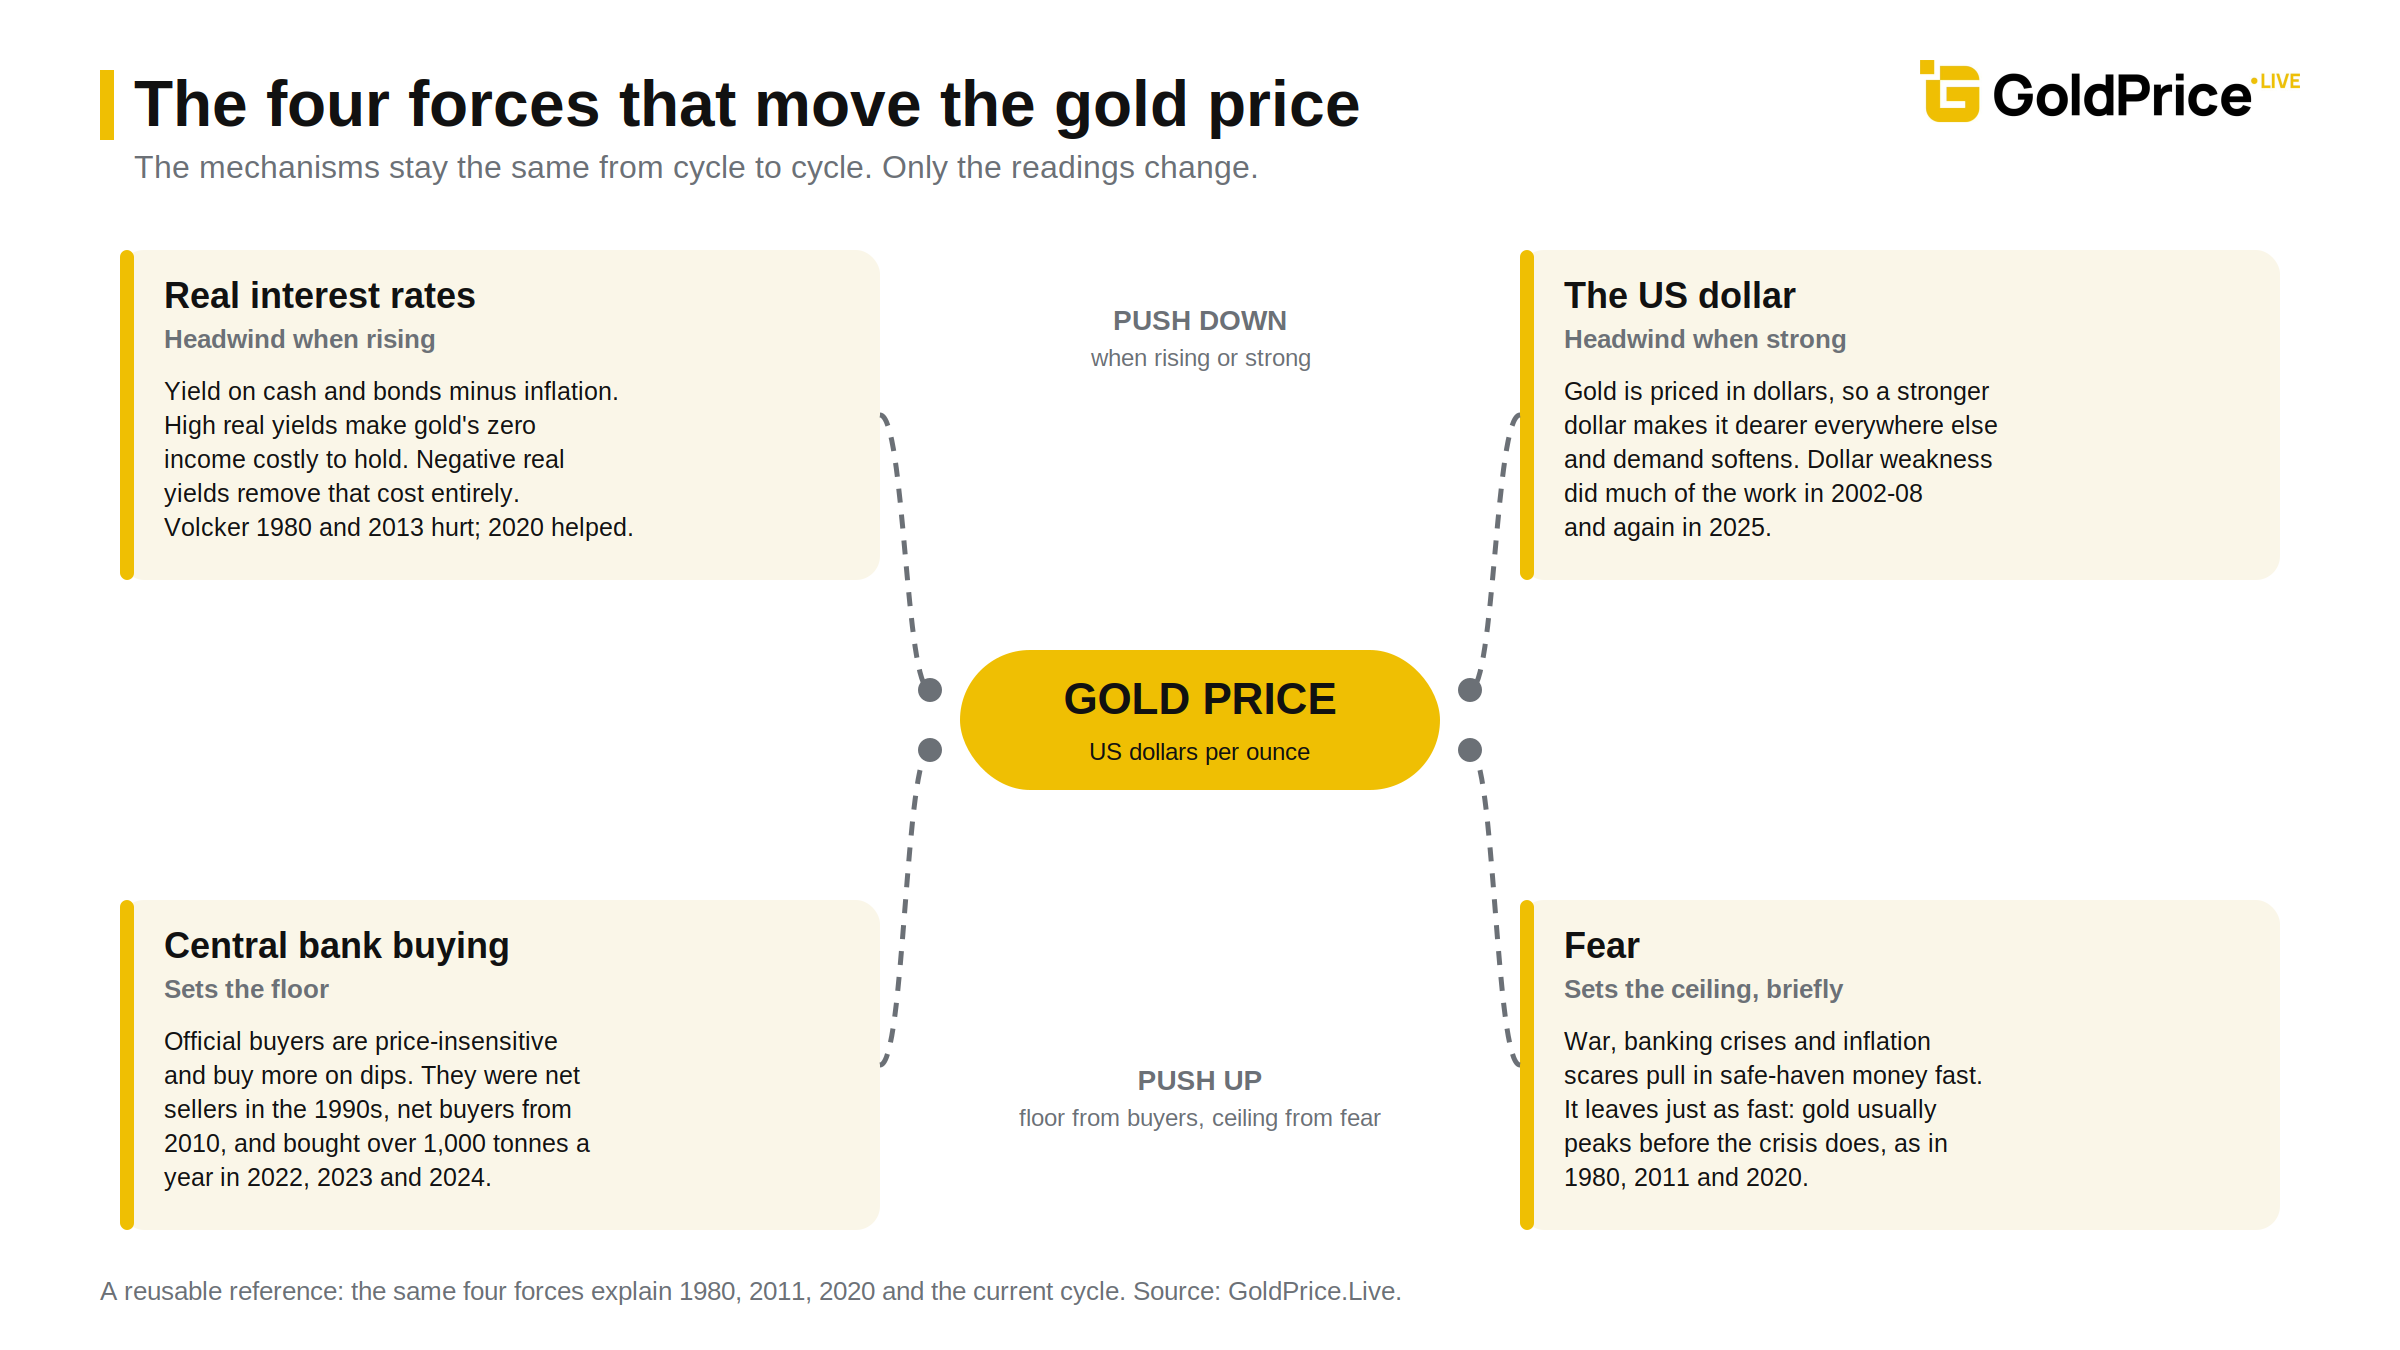 The mechanics first. Gold responds to four things above all: real interest rates, the US dollar, official demand from central banks, and fear. Rising real yields and a strong dollar are headwinds. Central bank buying sets a floor. Geopolitical or financial fear sets the ceiling, usually briefly.
Now the readings. In 2022 the Fed raised rates faster than at any time since the Volcker era, from near zero to over 4% in a single year. By the old rulebook that should have crushed gold. Russia's invasion of Ukraine in February sent the price to within a whisker of the 2020 record in early March, but the rate shock then pulled it back to around $1,620 by September. What stopped the fall was central banks. Having watched Russia's dollar reserves frozen by sanctions, official buyers led by China, Poland, Turkey and India bought a record 1,082 tonnes in 2022, the most since records began in 1950, and then more than 1,000 tonnes again in both 2023 and 2024. That buying is why gold finished 2022 flat rather than down 20%, despite the biggest rate shock in 40 years.
From there the cycle turned. Gold set a new record in December 2023 with the Fed still on hold, rose 27% in 2024 as the first rate cuts arrived, and then had a 2025 for the history books. Tariff shocks, a weakening dollar, record ETF inflows and relentless official buying drove gold through $3,000 in March, $4,000 in October and to a gain of more than 65% for the year, its best since 1979. January 2026 then delivered a dozen record highs in a single month, peaking near $5,600 intraday amid rising Middle East tensions, before a correction of roughly a quarter took the price briefly back below $4,000 by late June as the dollar firmed and the Fed turned hawkish again. Central banks, characteristically, bought the dip.
Whatever the price is doing as you read this, that pattern is the one to carry with you: a long bull run, a violent shake-out, and physical buyers underneath. The gold price 2000 to 2026 went from under $300 to a peak near $5,600, and it did not go there in a straight line.
This is what our data says about the three timeframes people search for most.
The 50-year trend is unambiguous. Since 1970 gold has compounded at around 9% a year, roughly doubling every eight years, through two long bull markets (1970-80 and 2001-11) and a third still running as I write. The 50 year chart is a staircase with two long landings, the 1980s-90s and 2012-19.
The 20-year trend is where gold earns its keep. In our data, only four rolling 20-year windows out of 36 ended in the red, and every one of them ended between 1999 and 2002, at the very bottom of the post-1980 bear market. Every 20-year period ending after 2002 has made money in nominal terms, usually a lot of it.
The 10-year trend is the one that catches people out. Ten of the 46 rolling 10-year windows since 1980 lost money, and all of them ended between 1989 and 2001. Anyone who bought near the 1980 or 2011 peaks and looked at their statement ten years later had a miserable time. Gold can and does go sideways or down for a decade. The good news is that no 10-year window ending after 2001 has lost money, and the 2015 to 2025 window returned about 15% a year, one of the seven best in the dataset.
The decade-by-decade scorecard shows why timing matters more than most people admit: over 30% a year in the 1970s, losses of 3.5% to 4% a year in both the 1980s and 1990s, about 18% a year in the 2000s, under 3% in the 2010s, and about 18% again in the first half of the 2020s. Gold is a feast-or-famine asset, and the famines are long.
 If I had to condense 50 years into three rules: buy when nobody wants it, don't expect anything for years at a time, and don't mistake the peak of a crisis for the peak of the price.
Every figure in this article comes from our daily dataset. You can explore the full record, zoom into any era, compare it with silver and switch currencies. Examine the 1980 spike, the 2011 top or the 2020 run yourself; the chart tells the story better than I can.
Founder of GoldPrice.Live and GoldBuzz.com. Passionate about gold and silver. Designed the 4-year Theseus research project. Ex-British Aerospace and Scotland Yard, now based in Canada.